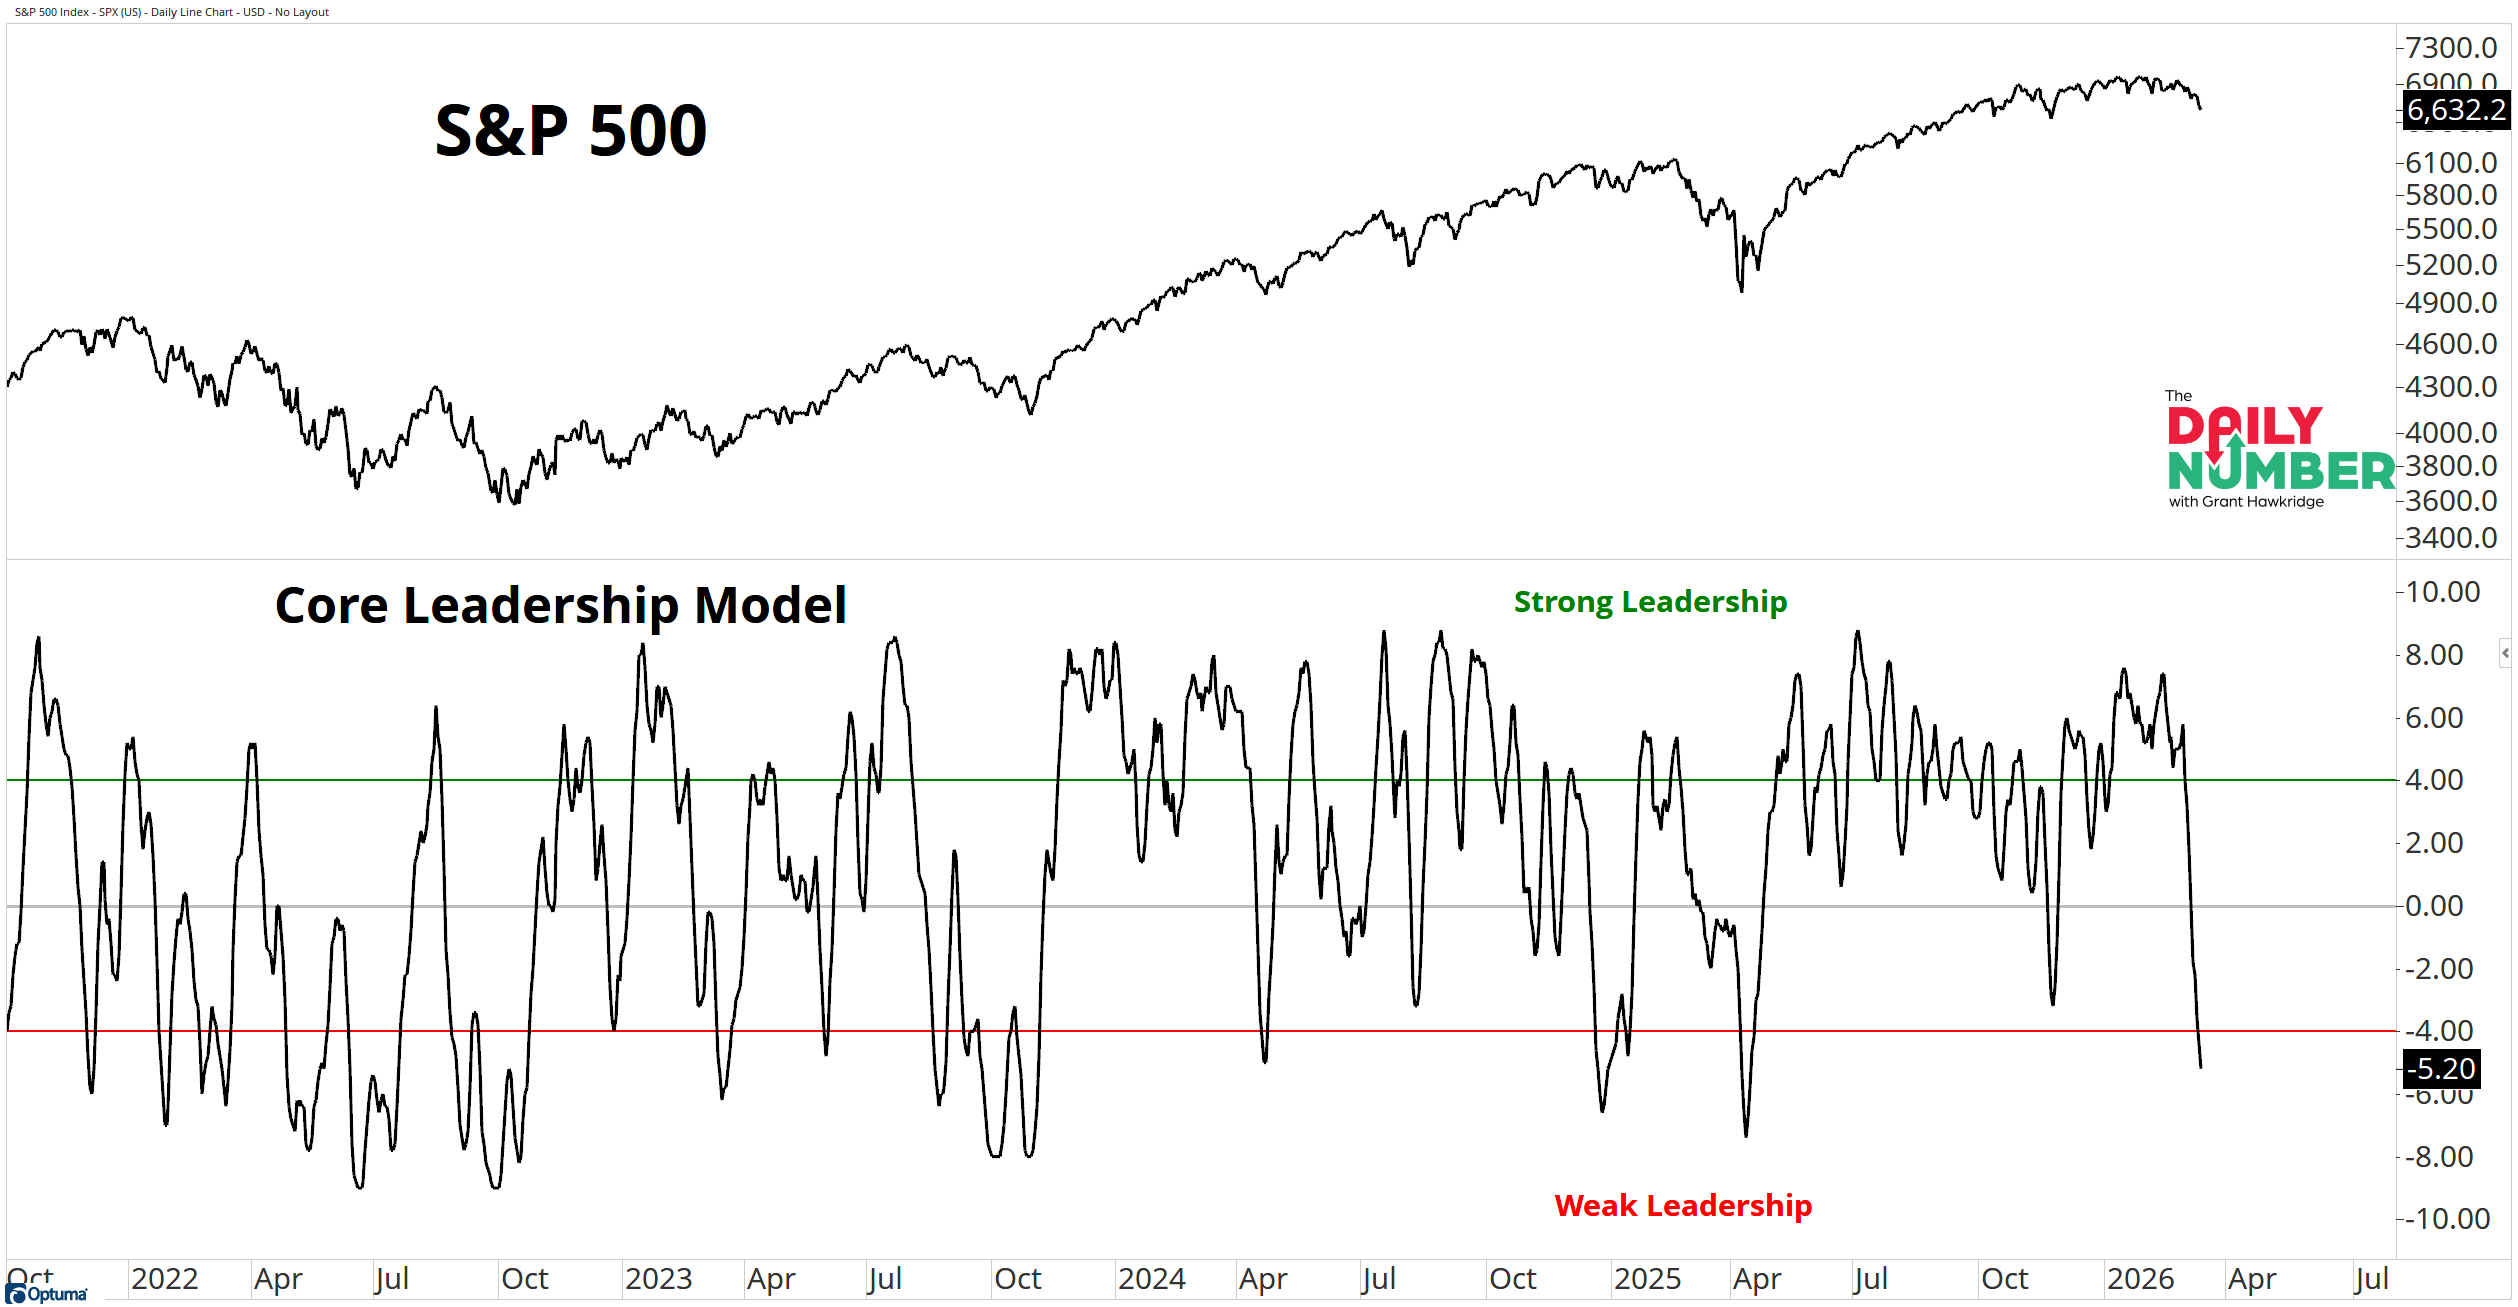
My Core Leadership Model sits at –5.2, deep in the weak leadership zone.
Here’s the chart:
Let's break down what the chart shows:
The top panel displays the S&P 500 in black.
The bottom panel displays my Core Leadership Model in black.
A green horizontal line appears near +4: Strong Leadership.
A red horizontal line appears near –4: Weak Leadership.
The Takeaway: My Core Leadership Model just dropped to –5.2. The reading now sits below the weak leadership threshold. The lowest reading since April 2025.
This model blends short, intermediate, and long-term breadth readings across US and global markets. My goal with this indicator is simple. Measure whether participation across markets is expanding or contracting.
During this current bull market the model spent long stretches above zero. Leadership kept returning after pullbacks. Participation expanded again and again as stocks pushed higher.
Now the reading flipped hard to the downside.
Breadth readings across timeframes rolled over at the same time. That type of move signals a contraction in leadership. Fewer stocks and fewer markets are carrying this market right now.
Bull markets recover from breadth resets all the time. But leadership needs to come back quickly.
If the model climbs back above zero, participation expands again and the trend stabilizes.
If it stays below zero, the rally runs on fewer and fewer stocks. That is when rallies run out of fuel.
Leadership already broke. The next move decides if this is a reset or the start of something bigger.
Grant Hawkridge | Chief Aussie Operator, All Star Charts
Steve walked through live trades in Coinbase, Amazon, Exxon, and more, including a 400% return in a matter of days. If you missed the session, the replay is up now.