Year to date, the S&P 500 has logged 24 up days of at least 1% and 23 down days of at least -1%.
Here’s the chart:
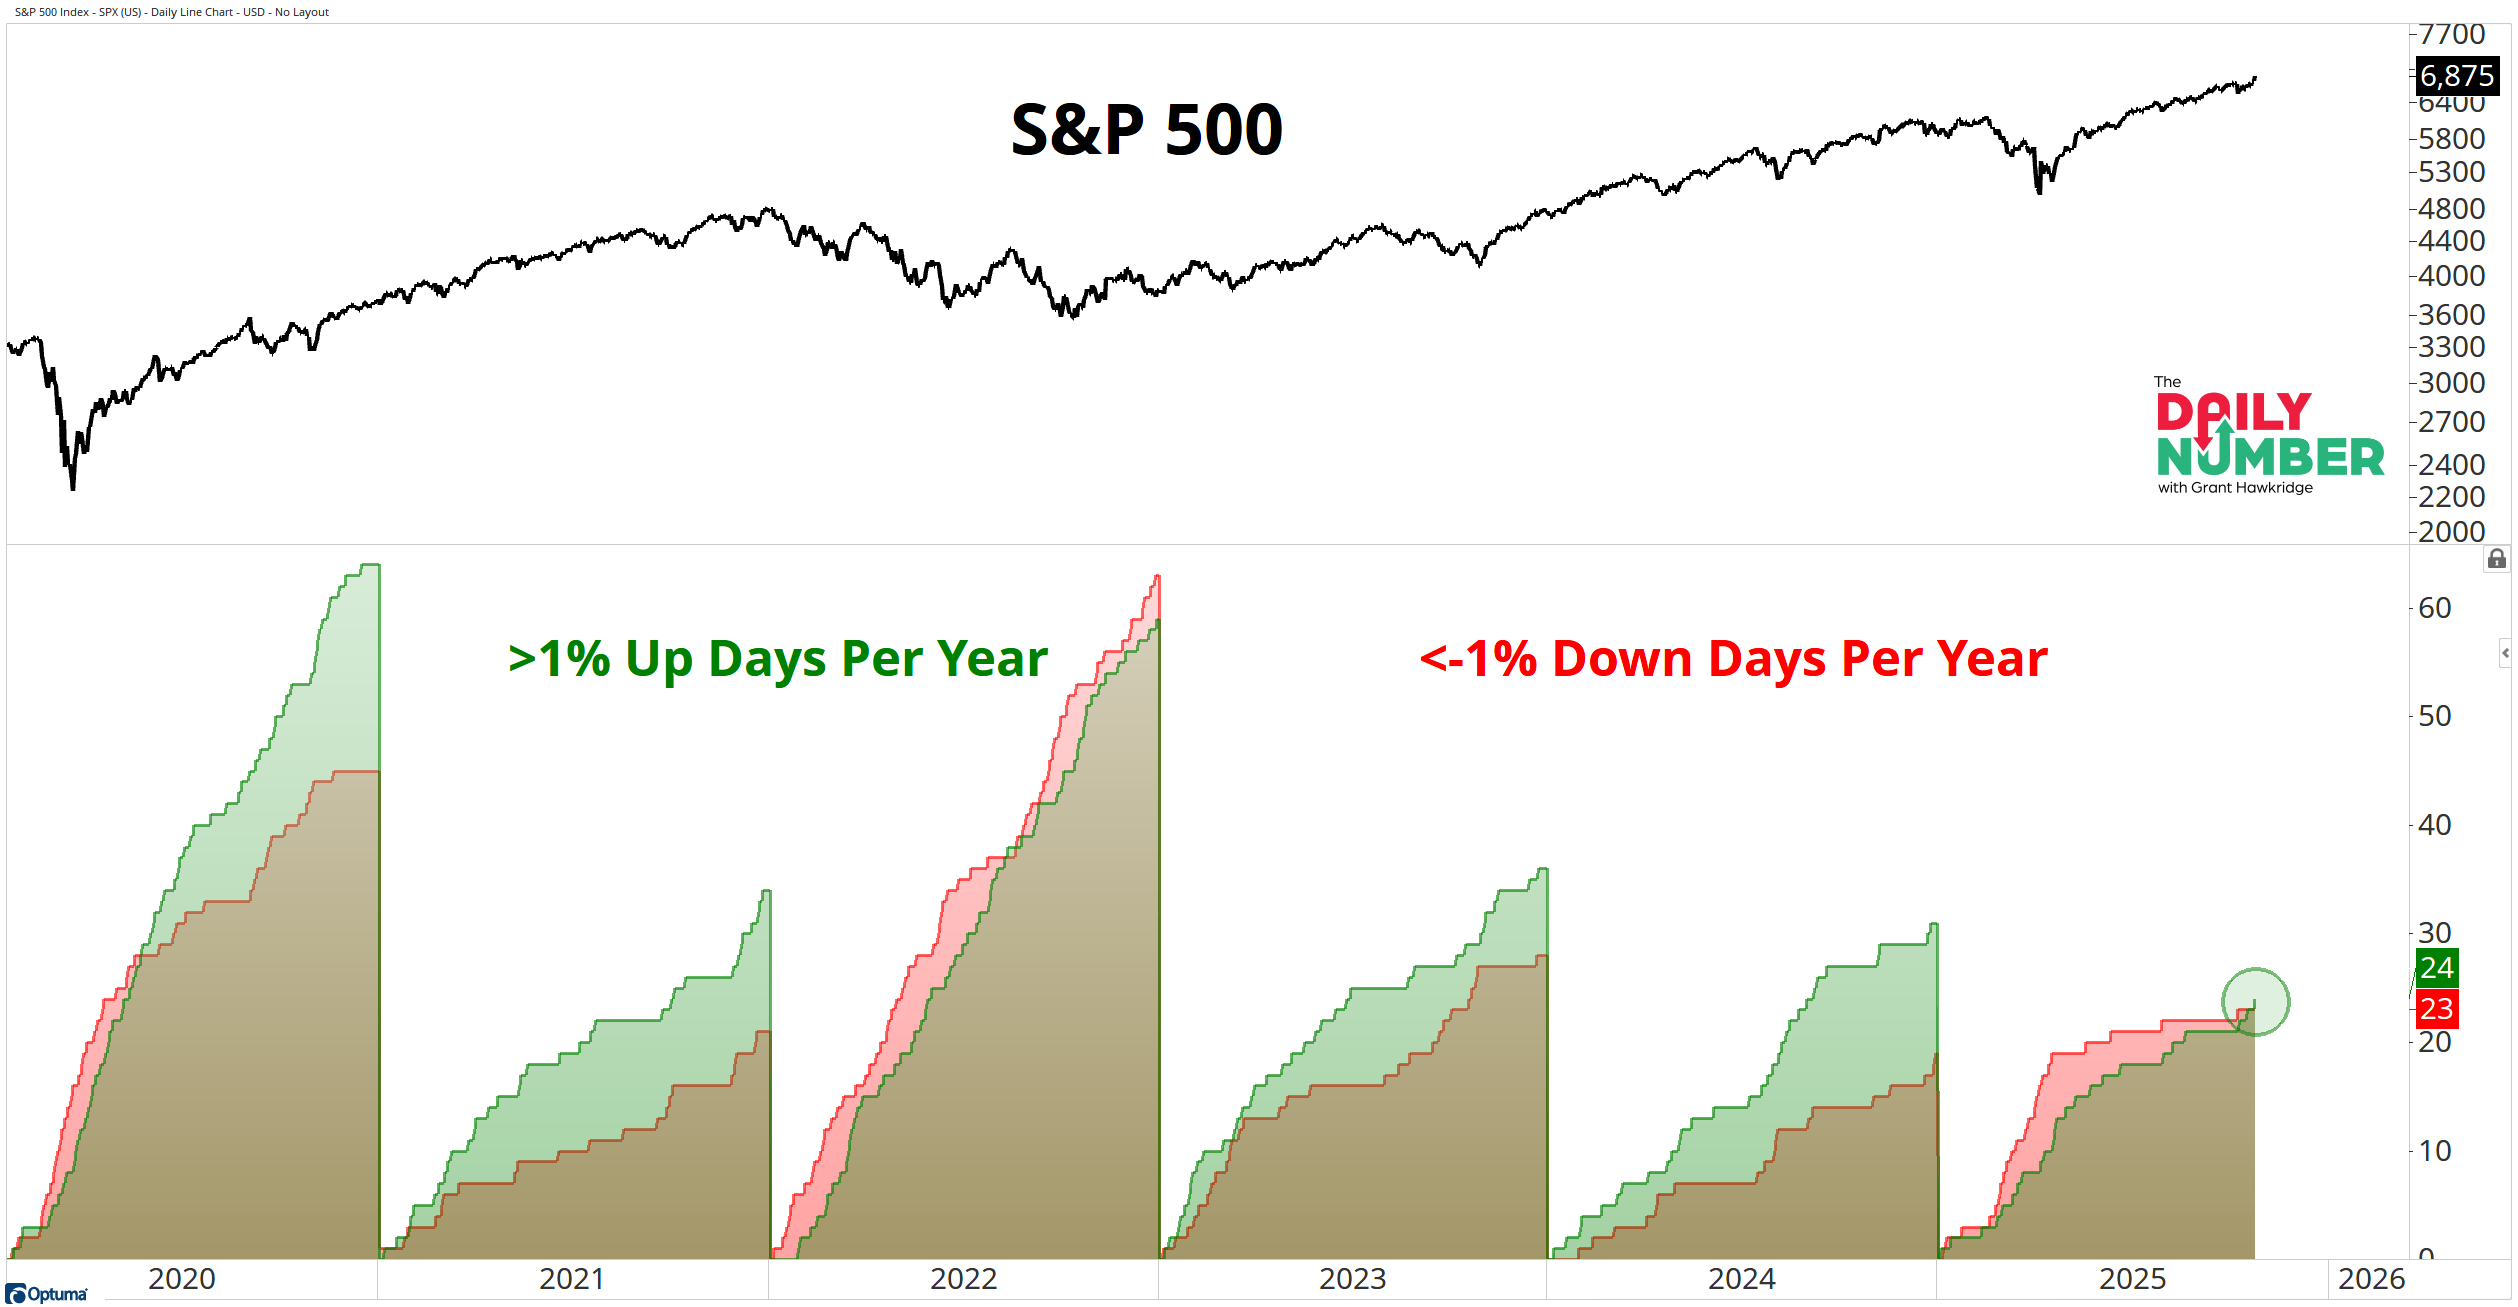
Let's break down what the chart shows:
The top panel shows a daily close for the S&P 500 in black.
The lower panels display yearly cumulative counts of large daily moves.
Green shows the number of days the index rose 1% or more.
Red shows the number of days it fell 1% or more
The Takeaway: Apart from the first week of January, this is the first time all year that green days outnumber red ones.
The count stands at 24 big up days and 23 big down days.
This small switch marks a quiet but important shift in volatility tone. For months, downside spikes had the upper hand. Now, the balance has tilted toward strength.
Years when large up days lead often coincide with steadier advances. It means volatility is leaning toward strength instead of stress.
This isn’t about one-day pops. It’s about the balance of pressure.
When the market’s largest swings are driven by buying, not selling, it tells us the path of least resistance is higher.
We saw the same flip in mid-2020, marking a point at which trends resumed after a bearish phase.
Do buyers keep control into year-end, or does red line take back the lead again?
If you find my content valuable, I would greatly appreciate it if you could share it with your friends, family, and colleagues. Your help in spreading the word is invaluable in supporting our work. Thank you to all of you who share!