The High–Low Logic Index just hit 5.8, its highest reading of 2025.
Here’s the chart:
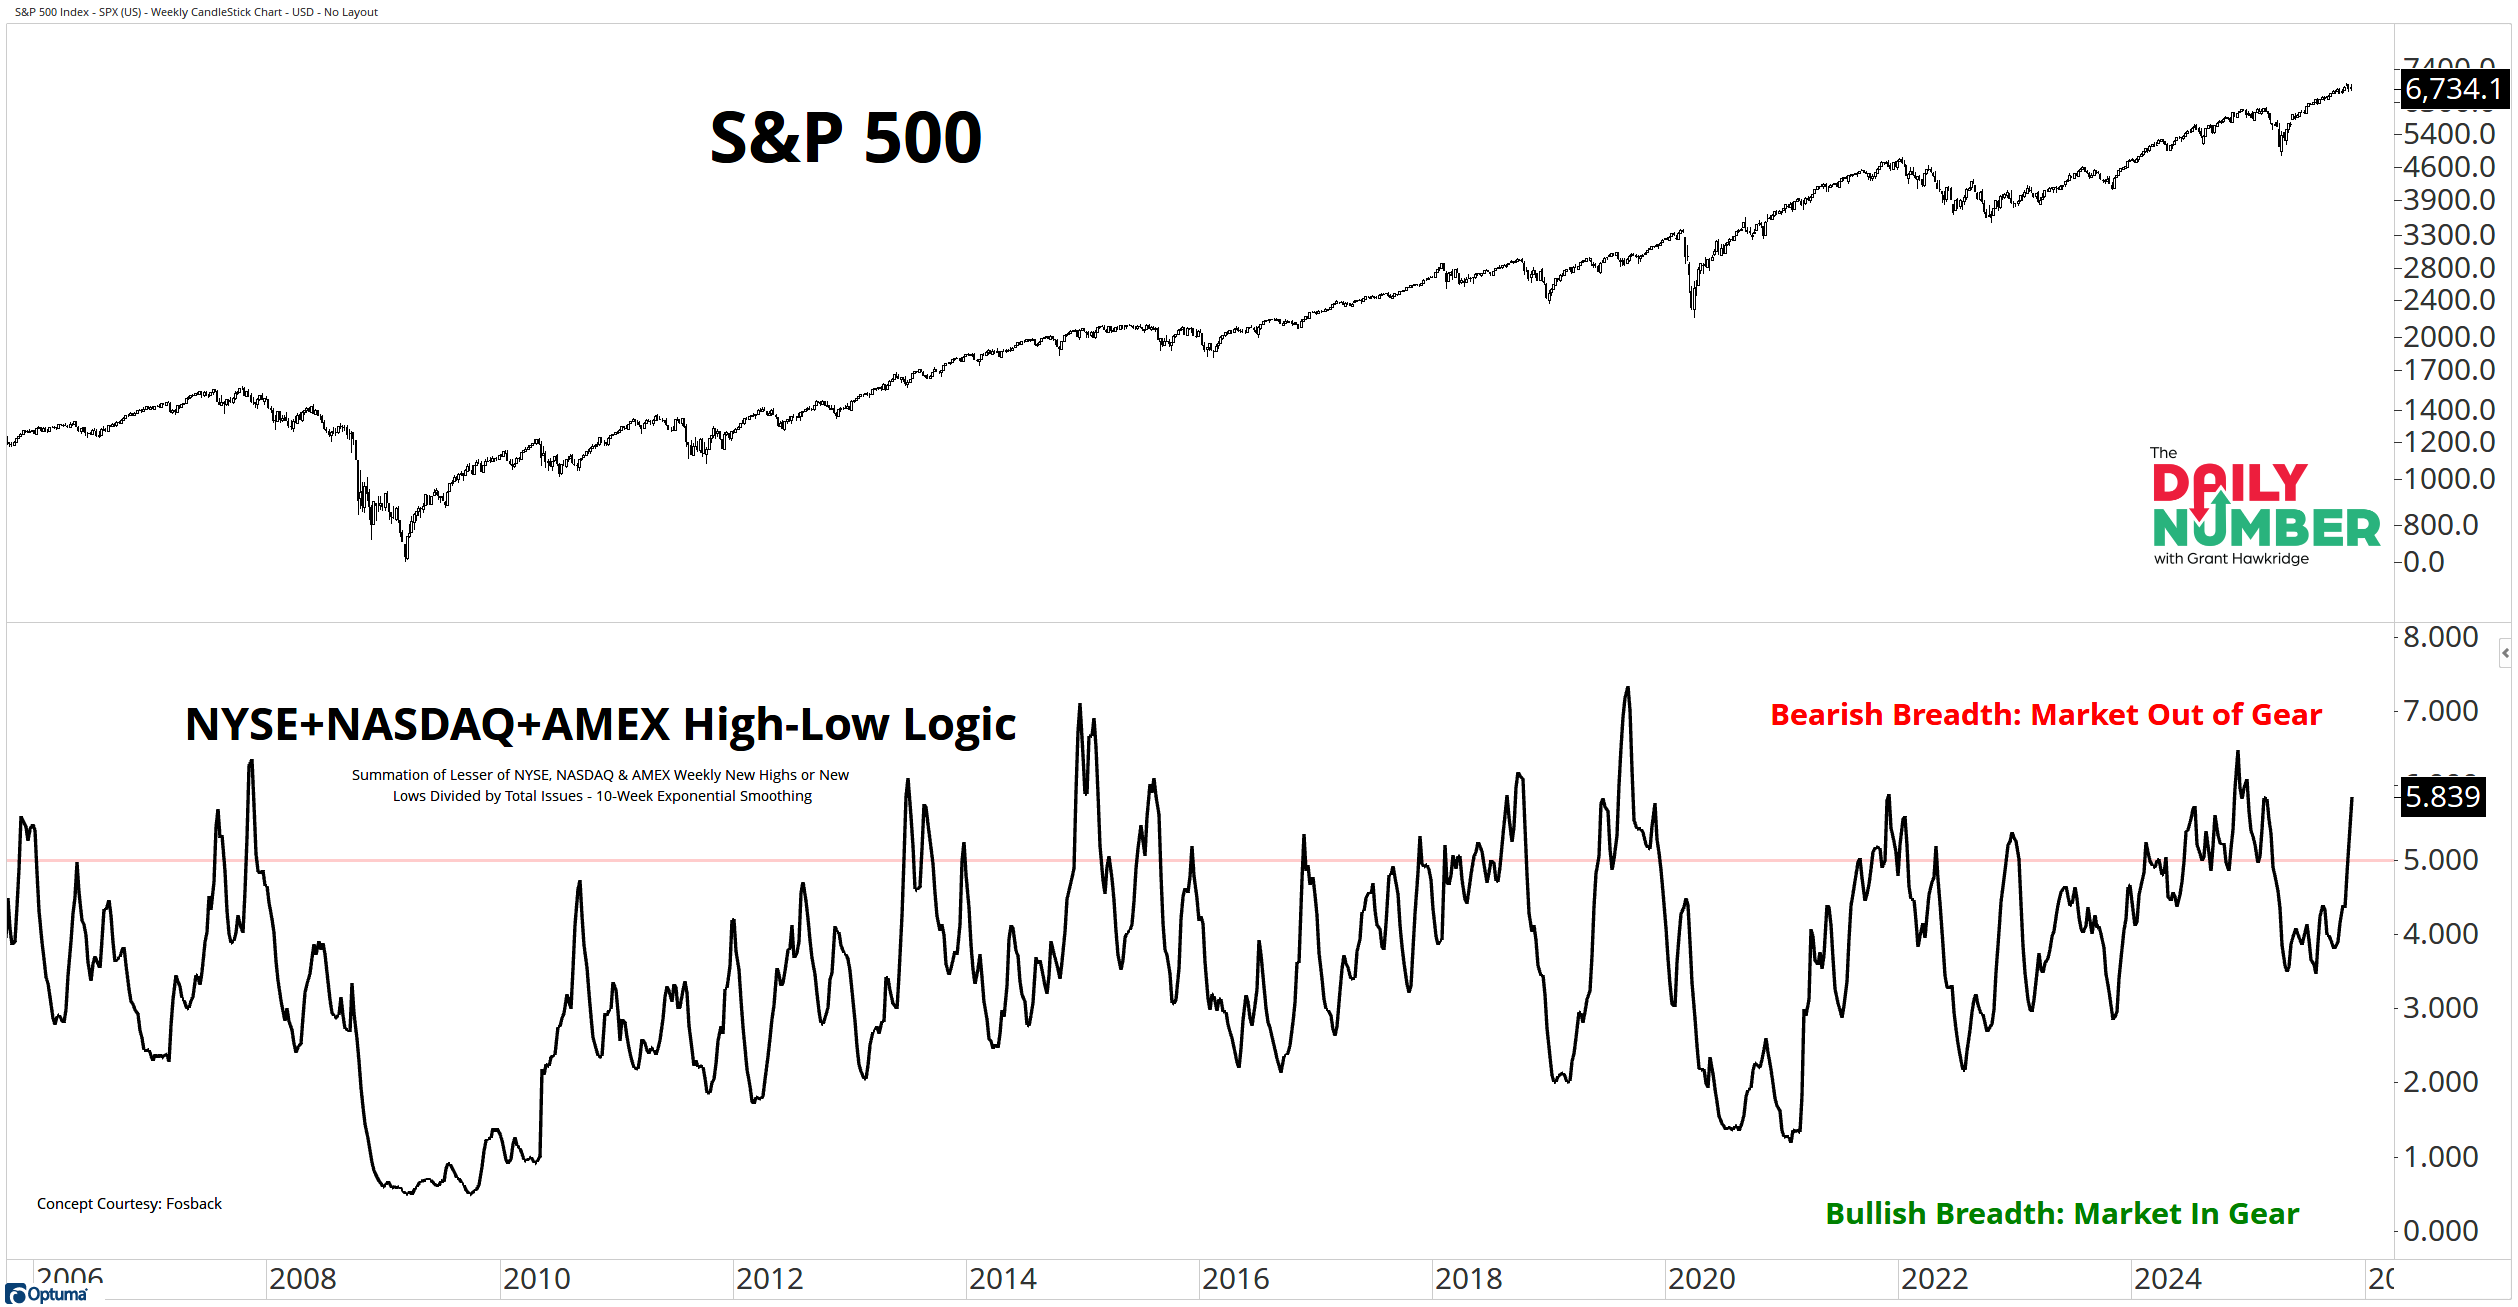
Let's break down what the chart shows:
The top panel displays the S&P 500 in black.
The bottom panel displays the NYSE+NASDAQ+AMEX High-Low Logic Index in black.
The Takeaway: Breadth is out of gear.
A 5.8 reading means many stocks hit new highs and many hit new lows at the same time.
This jump in the High–Low Logic Index says the market is running on mixed signals.
The High–Low Logic Index tracks the lesser of new highs or new lows each week. When both sides expand together, the lesser number rises. That rise reflects a market pulling in two different directions.
That mix creates noise rather than a strong trend.
Low readings show tight direction. High readings show conflict.
Readings under 4% returned 3.3% over three months on average, while readings above 4% returned only 0.9%.
When the tape pulls together, gains stack. When the tape fractures, gains shrink.
This spike to 5.8 pushes the market into one of the weakest zones.
This index does not call a top or forecast a crash. But it tells you the market is not in sync.
Buyers and sellers are both active.
So, does breadth snap back into gear, or does this split widen?
If you find my content valuable, I would greatly appreciate it if you could share it with your friends, family, and colleagues. Your help in spreading the word is invaluable in supporting our work. Thank you to all of you who share!