My two custom risk indexes are both hitting key levels today. One sits on support. The other sits under resistance.
Here’s the chart:
Let's break down what the chart shows:
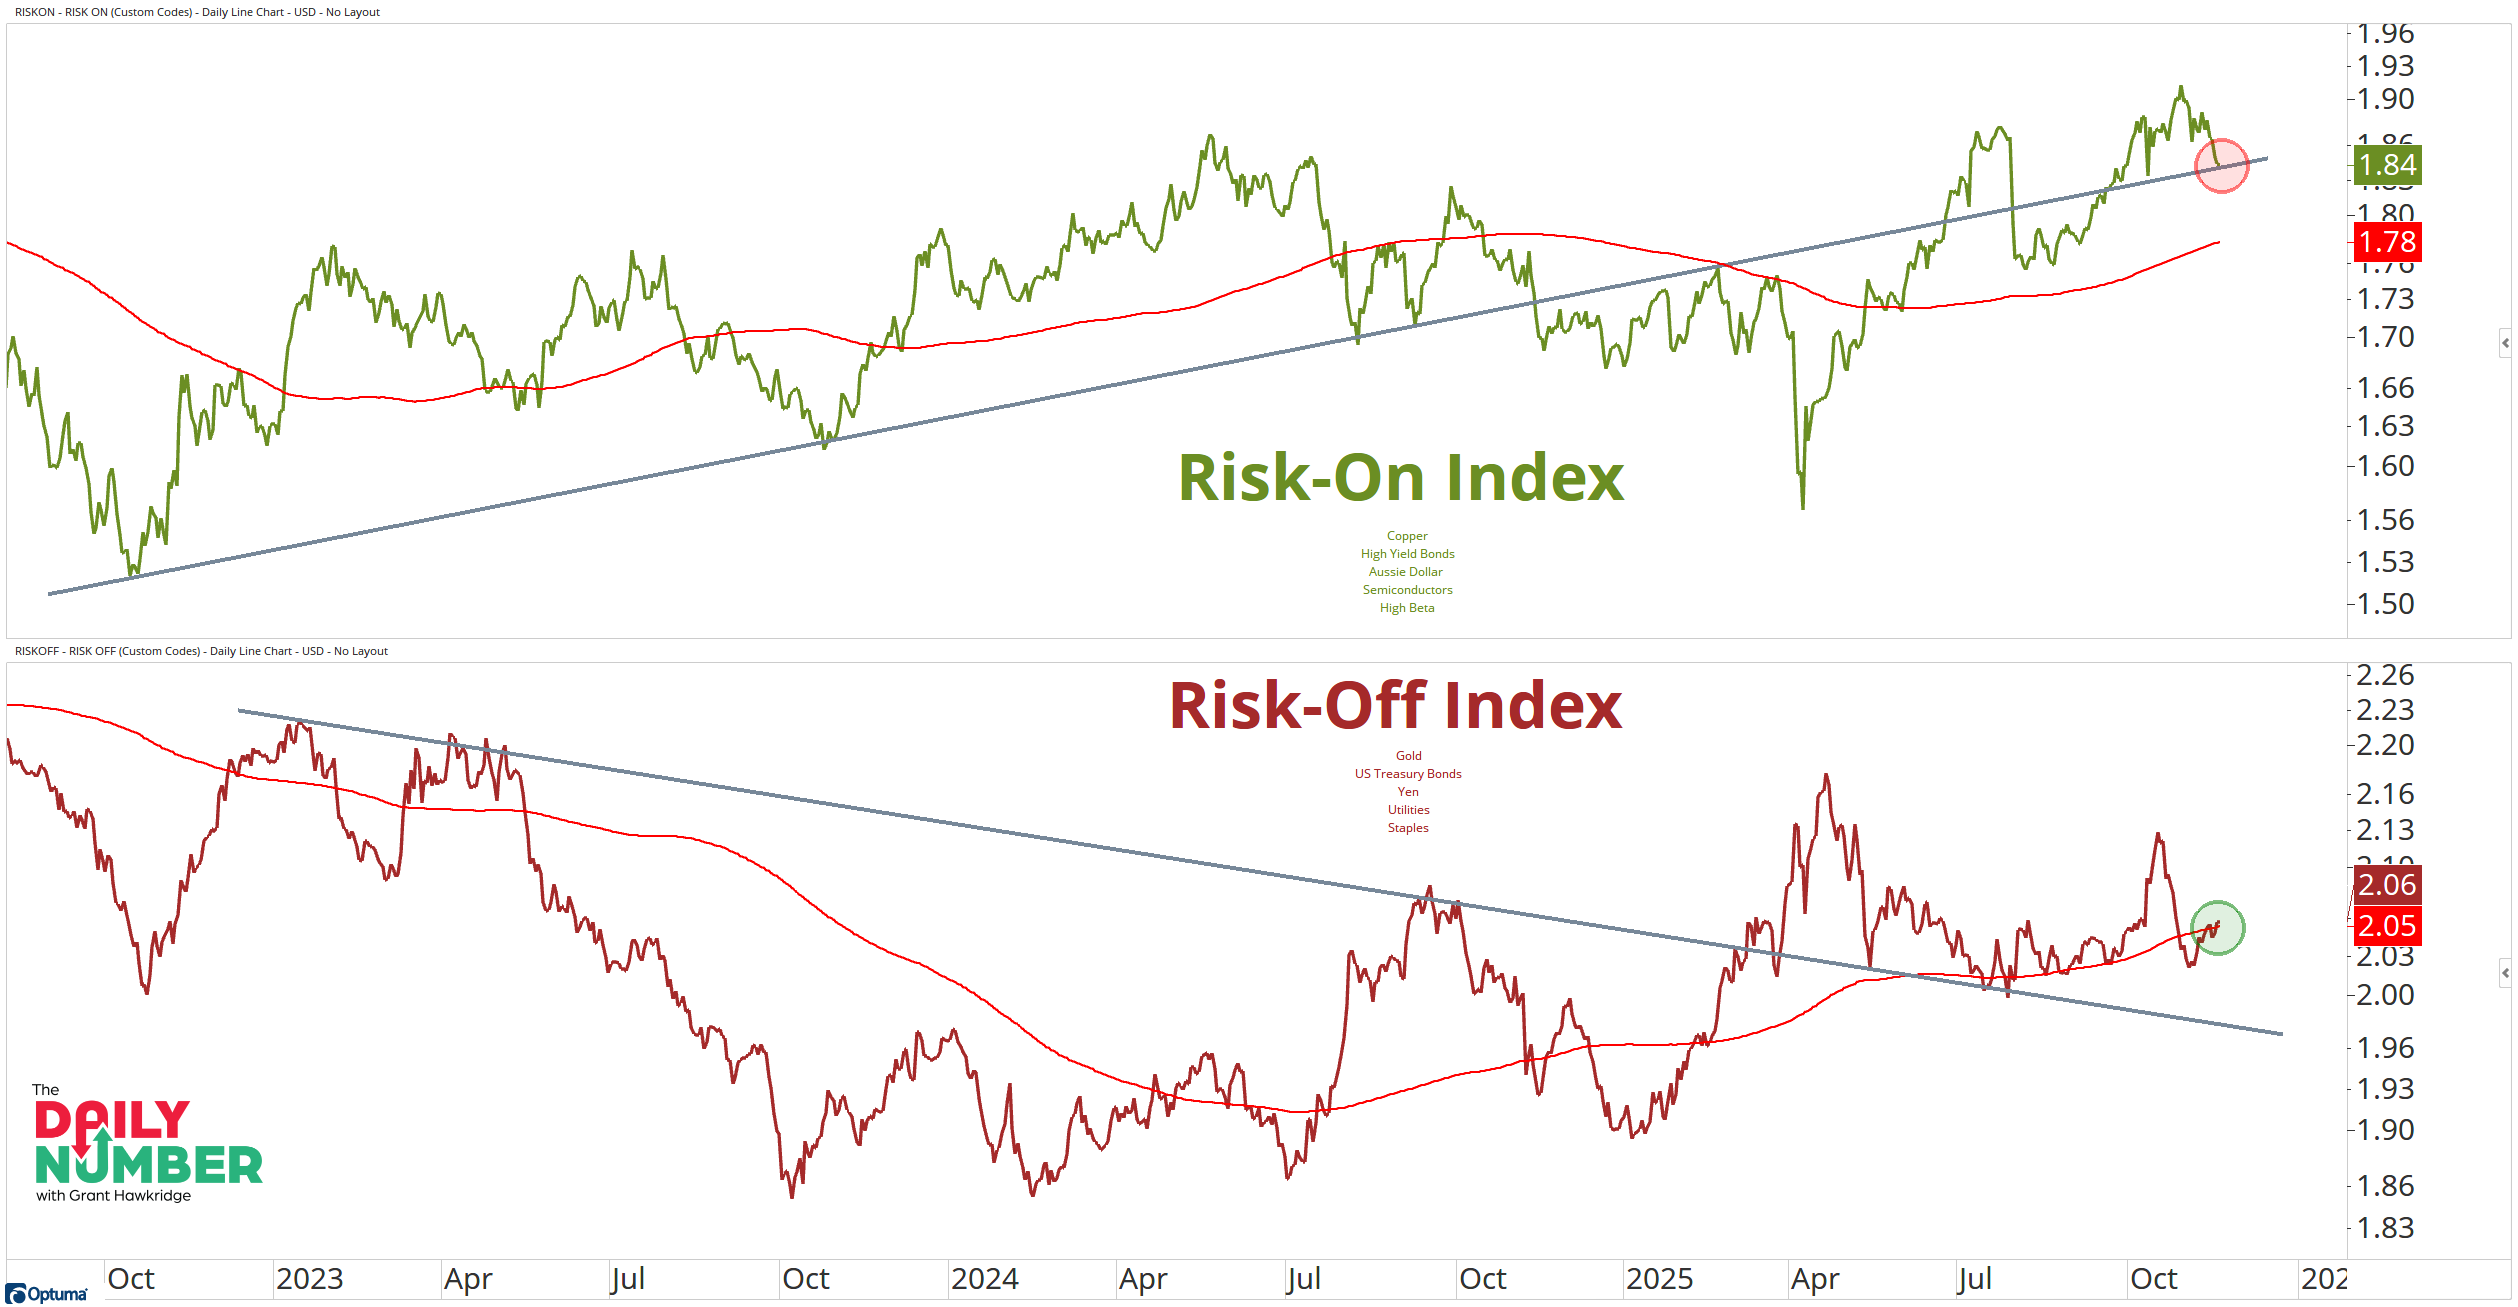
The top panel plots the Risk-On Index as a green line. The long-term trend line runs under price as a rising grey line. The 200-day moving average appears as a red line.
The bottom panel plots the Risk-Off Index as a dark red line. The long-term trend line runs above price as a falling grey line. The 200-day moving average appears as a red line.
The Takeaway: Risk-On has come straight back to support. Same trend line that’s defined the uptrend since 2023. Price is sitting right on it now, still above the 200-day. Nothing’s broken yet.
If it holds here and turns higher, risk stays in charge into year-end. Simple as that. Buyers just need to show up. Hold this line and the trend keeps rolling.
Risk-Off is doing the opposite. It’s pressing straight into the 200-day. It hasn’t cleared it yet, but it’s close. One strong push and the gauge flips. A move through the 200-day would show defensive momentum building. That’s when risk appetite fades.
Both gauges are at decision points.
Risk-On at support.
Risk-Off at resistance.
You don’t often see both sides press into key levels together. That’s what makes this setup matter.
If Risk-On bounces, bulls keep control. If Risk-Off breaks out, defence takes over.
If you find my content valuable, I would greatly appreciate it if you could share it with your friends, family, and colleagues. Your help in spreading the word is invaluable in supporting our work. Thank you to all of you who share!