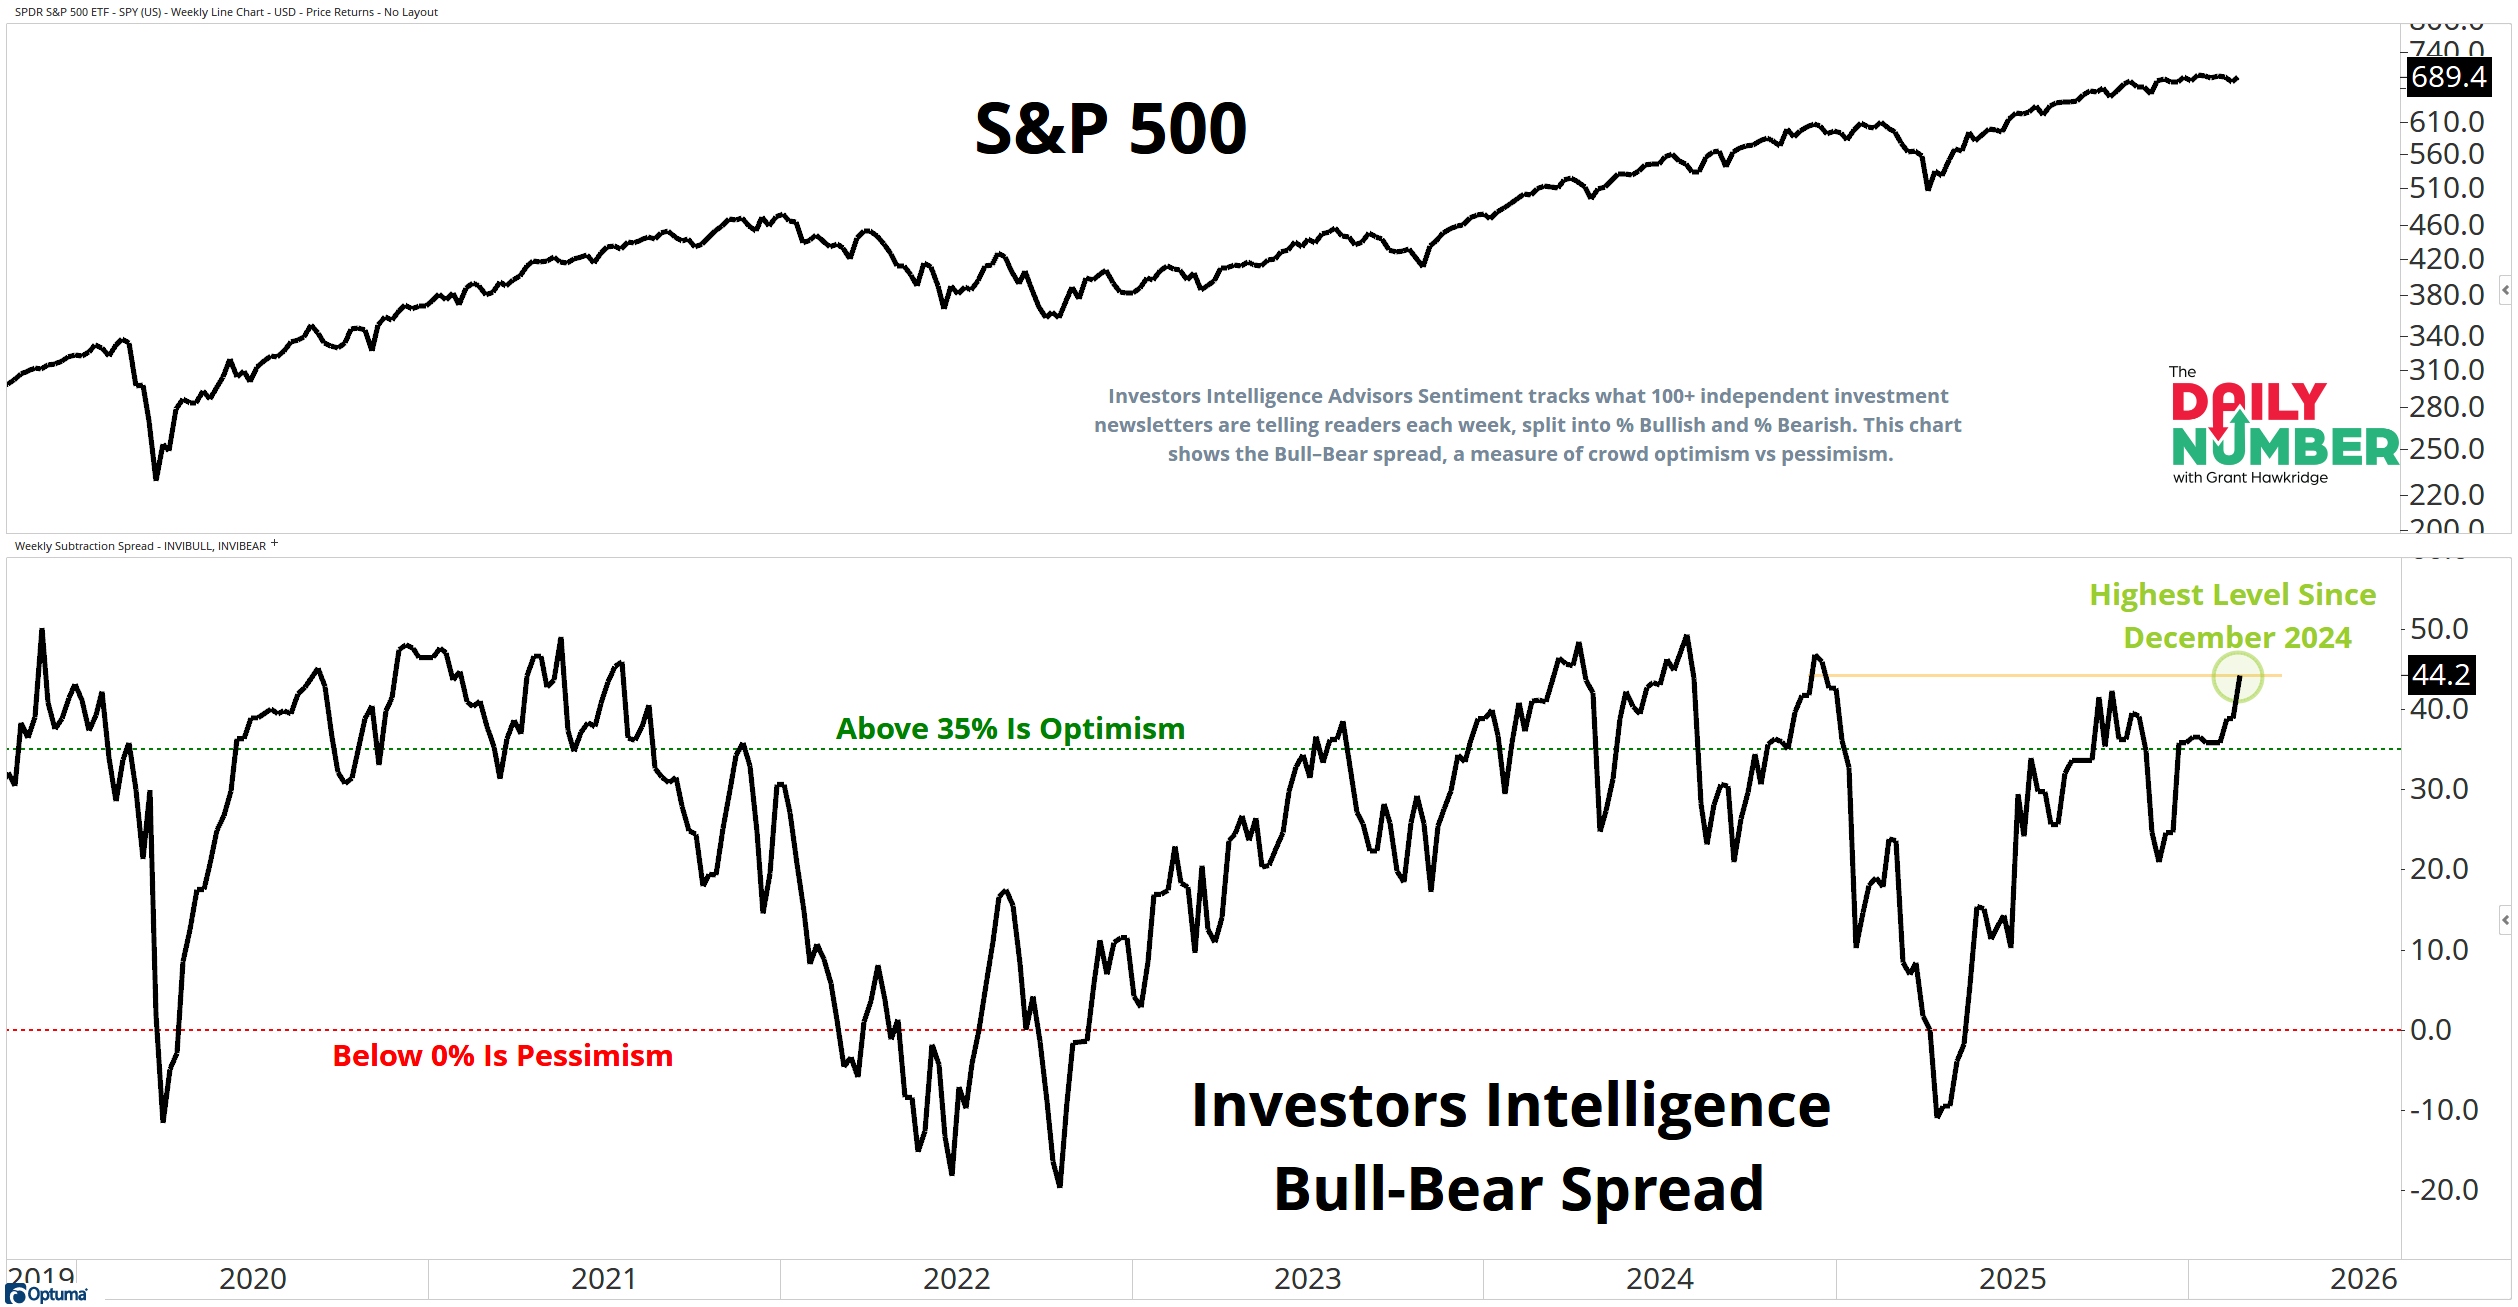
The Investors Intelligence Bull–Bear spread sits at 44.2%, its highest reading since December 2024.
Here’s the chart:
Let's break down what the chart shows:
The top panel displays the S&P 500 as a black weekly line.
The lower panel displays the Investors Intelligence Bull–Bear spread as a black line. A green dotted line marks 35%. A red dotted line marks 0%.
The Takeaway: 44.2% means bulls have the edge.
Independent newsletters are leaning heavily to the long side and the spread sits well above 35%, that is where real optimism starts to build.
You need bulls for a bull market and they are here.
The S&P 500 is pressing at highs and the spread is expanding with it. This is not a yet a warning sign. That is bull market confirmation. Price is strong and the crowd is leaning into it.
This is bullish, but it is not at extreme levels. Prior cycle peaks pushed toward 50%. Yes, we are elevated, but not at euphoric levels just yet. There is still room before this becomes too crowded.
Strong trends keep people bullish and Bulls can stay bullish longer than expected when price keeps rewarding them. That is how momentum works.
The risk shows up when optimism stays high but price stops pushing higher. That is when bulls stop getting paid.
Right now, the bulls have the numbers. So, how far can they press it before sentiment becomes a problem?