100% of the holdings in the NYSE Arca Oil Index are trading above their 200-day moving average.
Here’s the table:
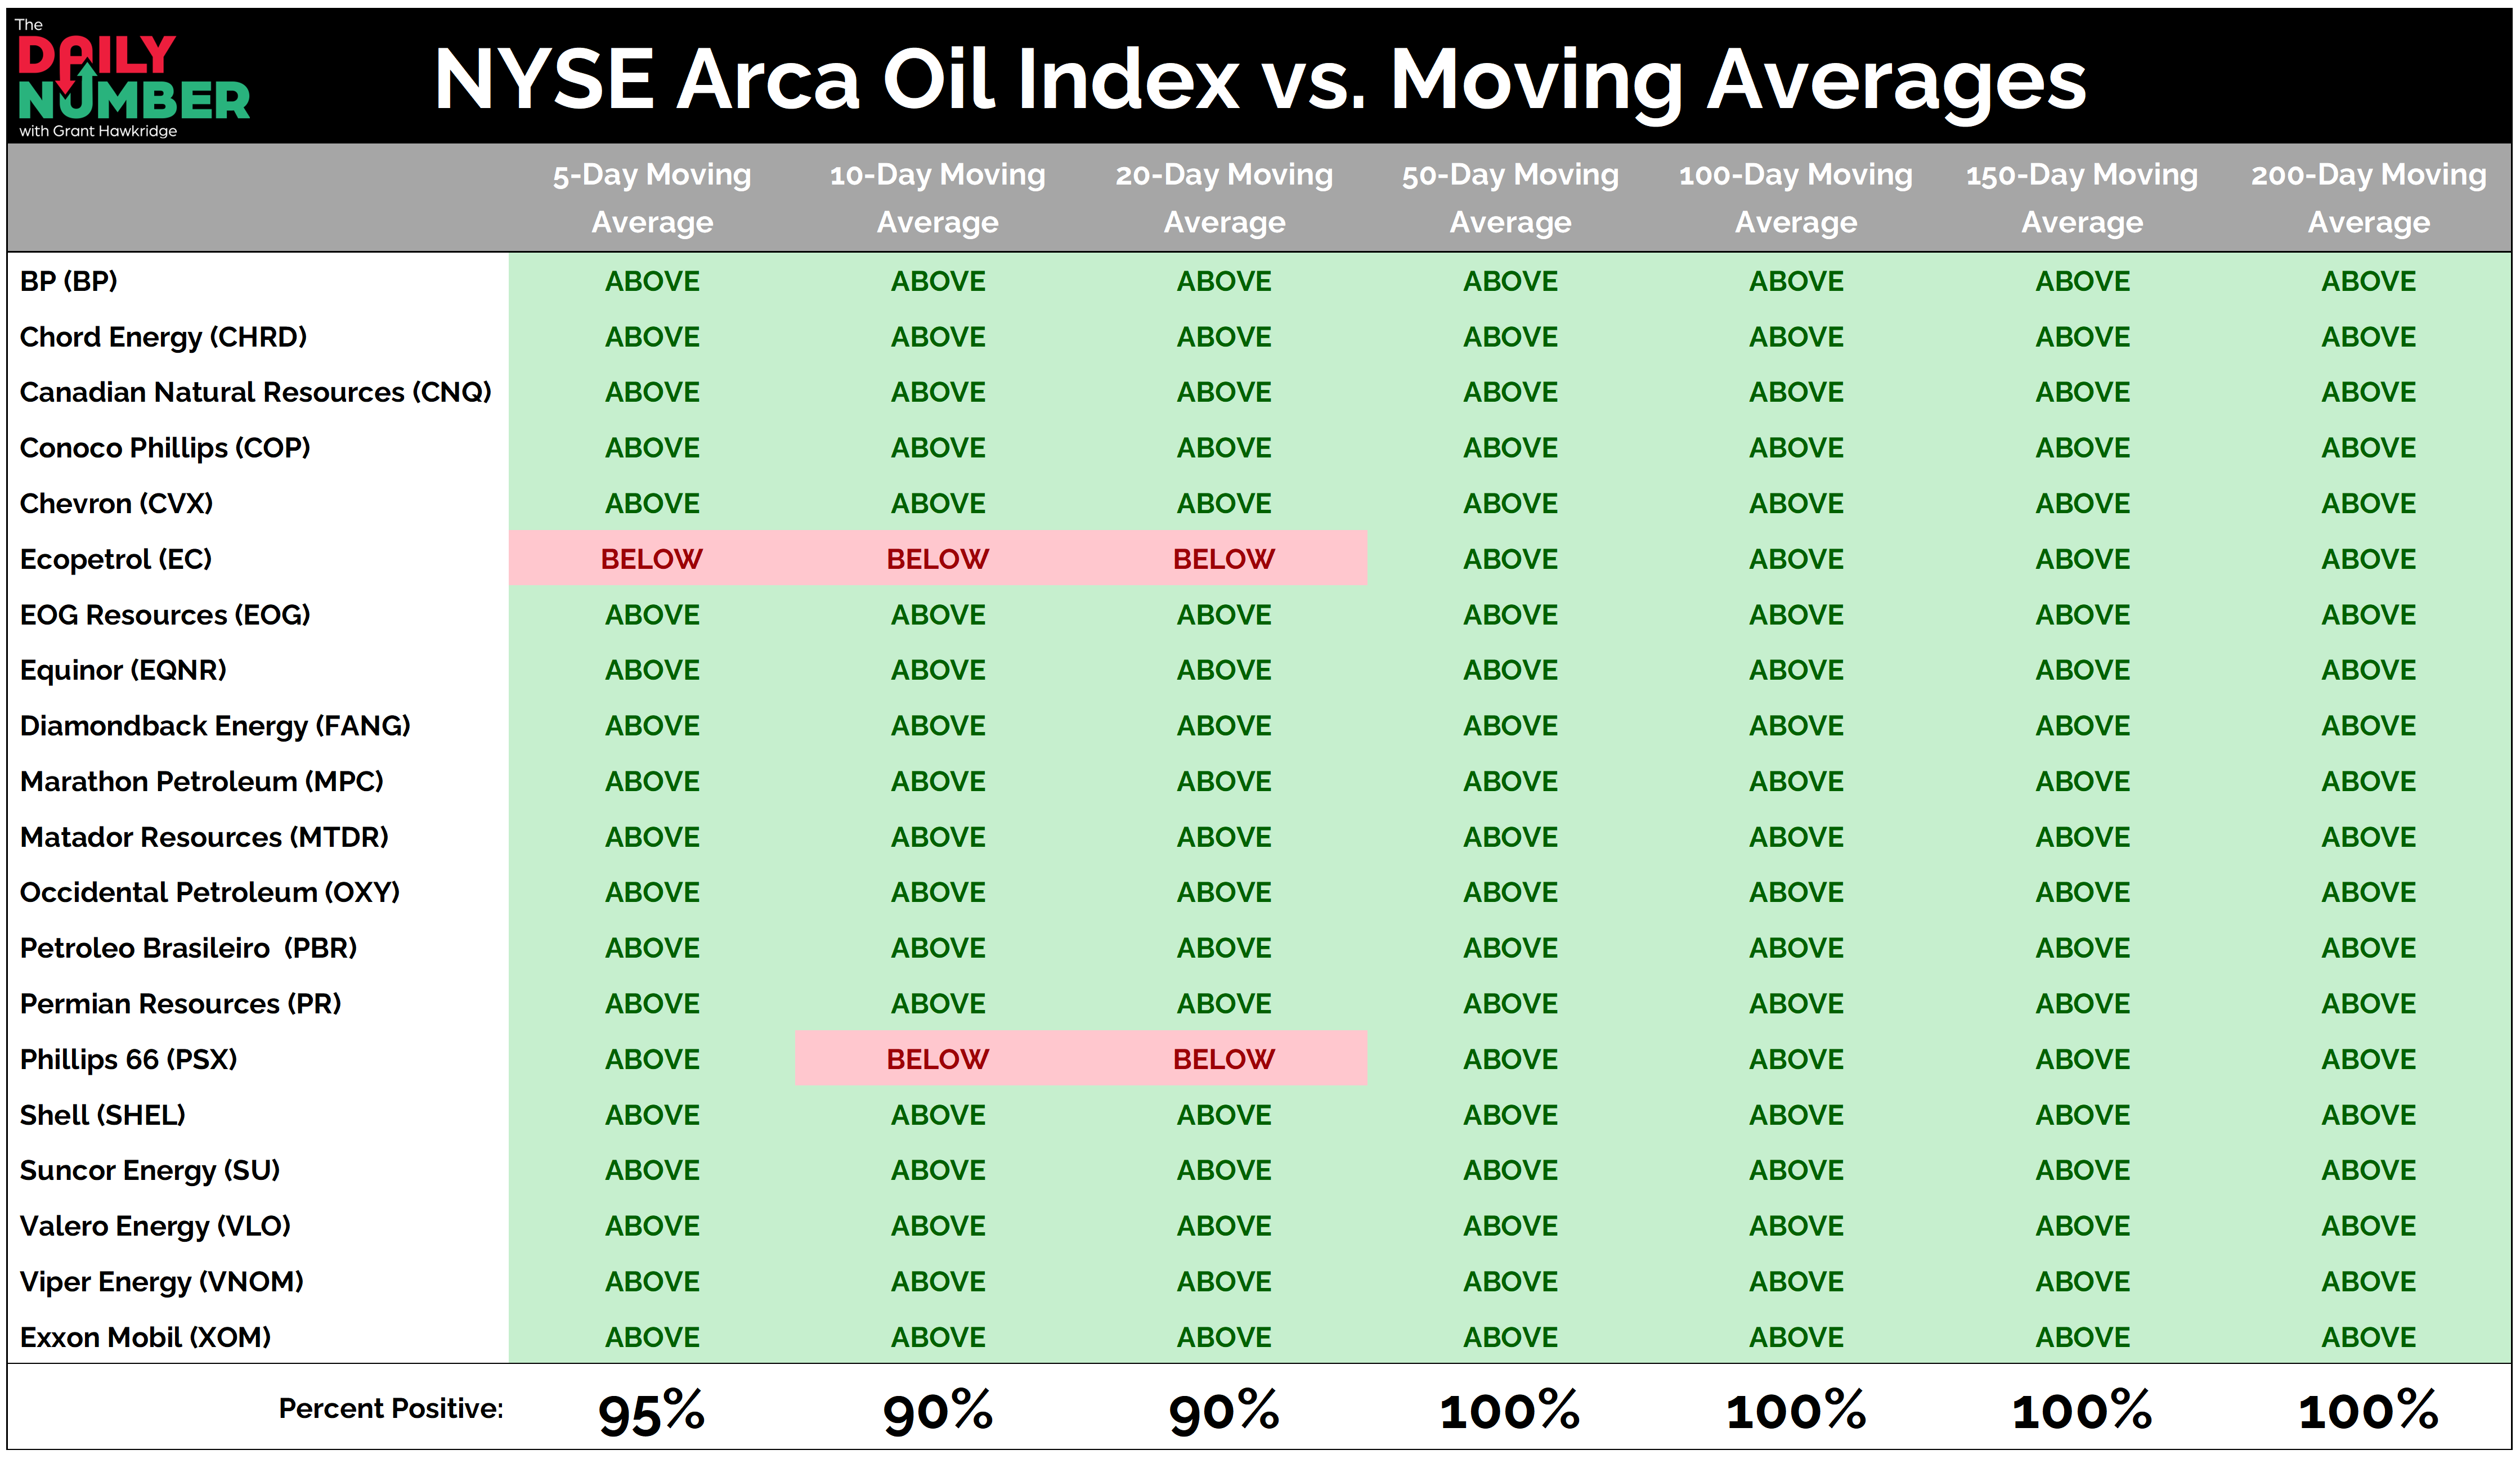
Let's break down what the table shows:
The table lists the holdings of the NYSE Arca Oil Index in rows.
Columns display whether each stock is above or below its 5-day, 10-day, 20-day, 50-day, 100-day, 150-day, and 200-day moving averages.
Green cells labeled ABOVE show stocks whose price is trading above the moving average.
Red cells labeled BELOW show stocks whose price is trading below the moving average.
The bottom row displays percentage readings for each moving average group.
The Takeaway: 100% of energy stocks are trading above their 200-day moving average. Every component is trending higher at the same time, which means strength is not coming from a few standout names. Energy bulls are supporting the entire group.
Participation carries through, with the 50-day through 200-day readings all at 100%, as majors, producers, refiners, and international operators push higher together. Leadership is spread across the industry instead of clustering in one pocket, which keeps the advance supported even as individual stocks pause.
Zooming in, shorter timeframes tell the same story. Between 90% and 95% of stocks remain above their 5-day through 20-day averages. A few names are pulling back, but the broader move higher holds steady. Weakness stays contained instead of spreading, exactly what you want to see during an ongoing advance.
When participation sits this high, risk rarely starts with an immediate price break. It usually begins with fewer stocks holding above their shorter averages. That shift would signal energy bulls becoming more selective. Until that happens, pullbacks look like digestion, not a change in trend.
If every stock already trades above trend, what finally brings sellers back?