The Zweig Breadth Thrust has 9 trading days left to move from below 0.40 to above 0.615.
Here’s the chart:
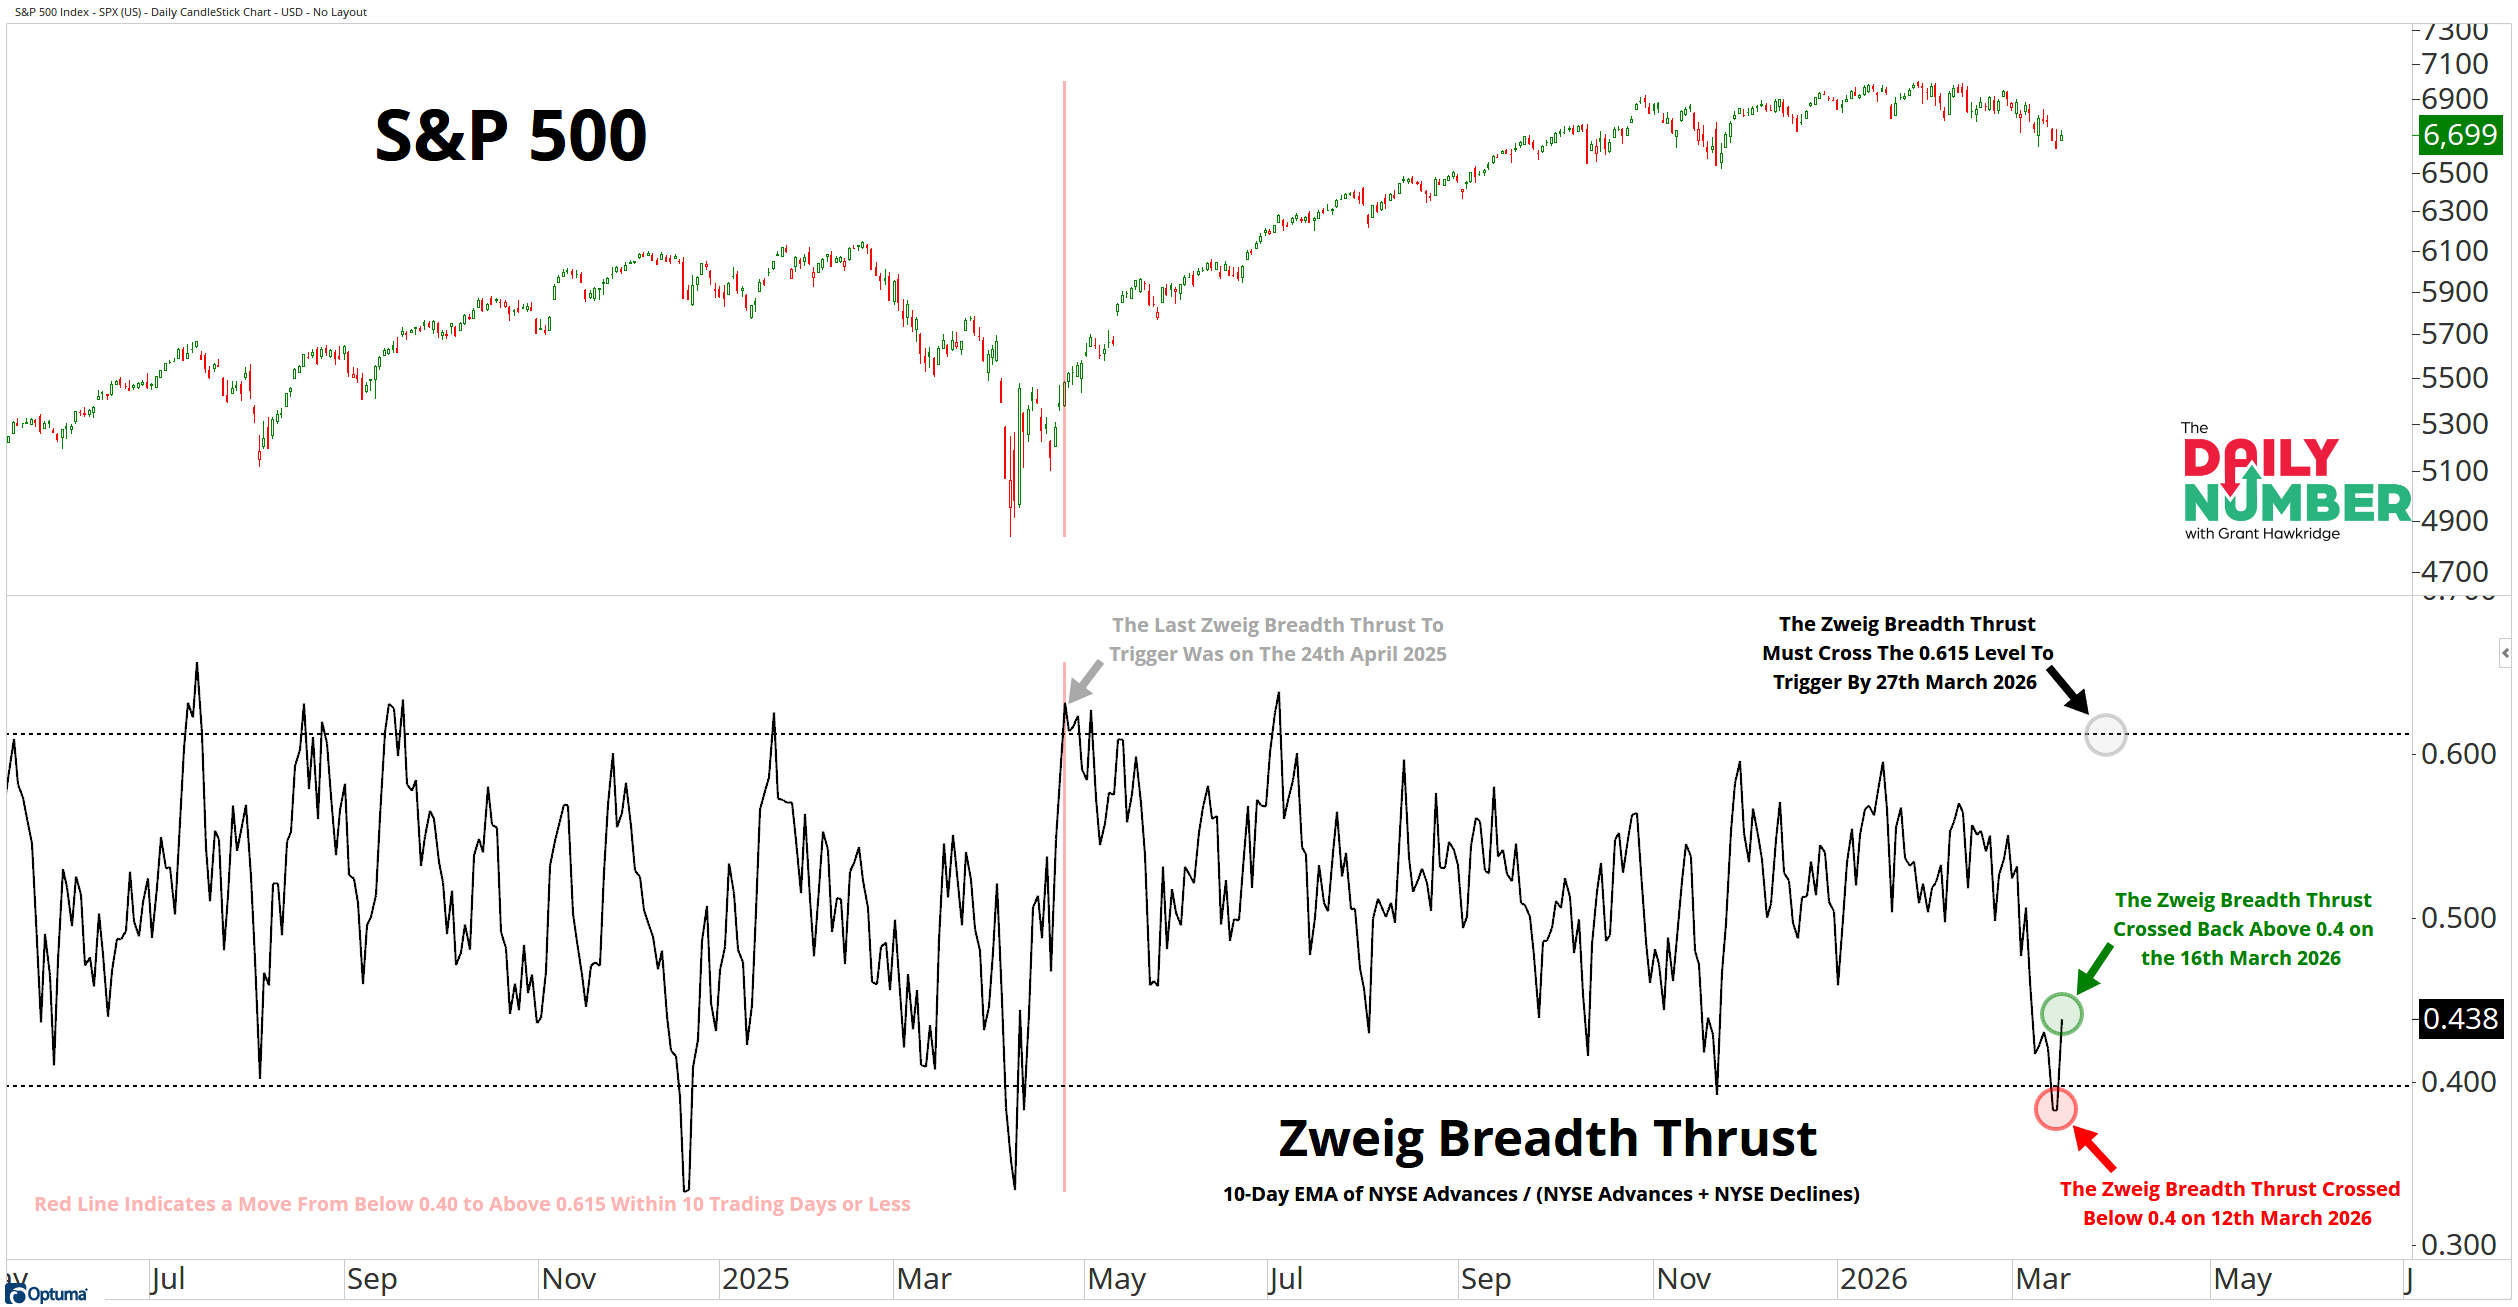
Let's break down what the chart shows:
The chart displays the S&P 500 in black in the top section.
The lower section displays a black line representing the Zweig Breadth Thrust.
A black dashed horizontal line appears at 0.615.
A black dashed horizontal line appears at 0.400.
A red vertical line marks prior thrust signals.
The Takeaway: The clock is now running.
Breadth reset below 0.40 and moved back above it. That opened the Zweig Breadth Thrust window.
This setup is about speed.
The rules are strict.
Breadth must now reach 0.615 within 10 trading days. That leaves 9 days left.
From here, it either expands fast or it fails to fire.
The last signal fired in April 2025 and price followed with a strong run. That move is now up more than 22% with about 29 trading days left in the 12-month window. The average Zweig Breadth Thrust return is 20.3% over 12 months. This one is already above that average. That is what you want to see. Strong thrusts hold their gains and keep building.
History backs it up. 94.1% of Zweig Breadth Thrust signals are positive after 12 months. The average gain is 20.3%. That edge only exists after confirmation.
That is the track record.
Here is where we are now. The index has been flat for months and sits about 4% below its highs. This is not a deep reset. This is a range. Price has worked sideways instead of lower. A thrust here would mark a shift out of that range and back into expansion.
Grant Hawkridge | Chief Aussie Operator, All Star Charts
Steve walked through live trades in Coinbase, Amazon, Exxon, and more, including a 400% return in a matter of days. If you missed the session, the replay is up now.