Moody’s Baa corporate bond yield 26-week momentum is at 0.26, back above zero.
Here’s the chart:
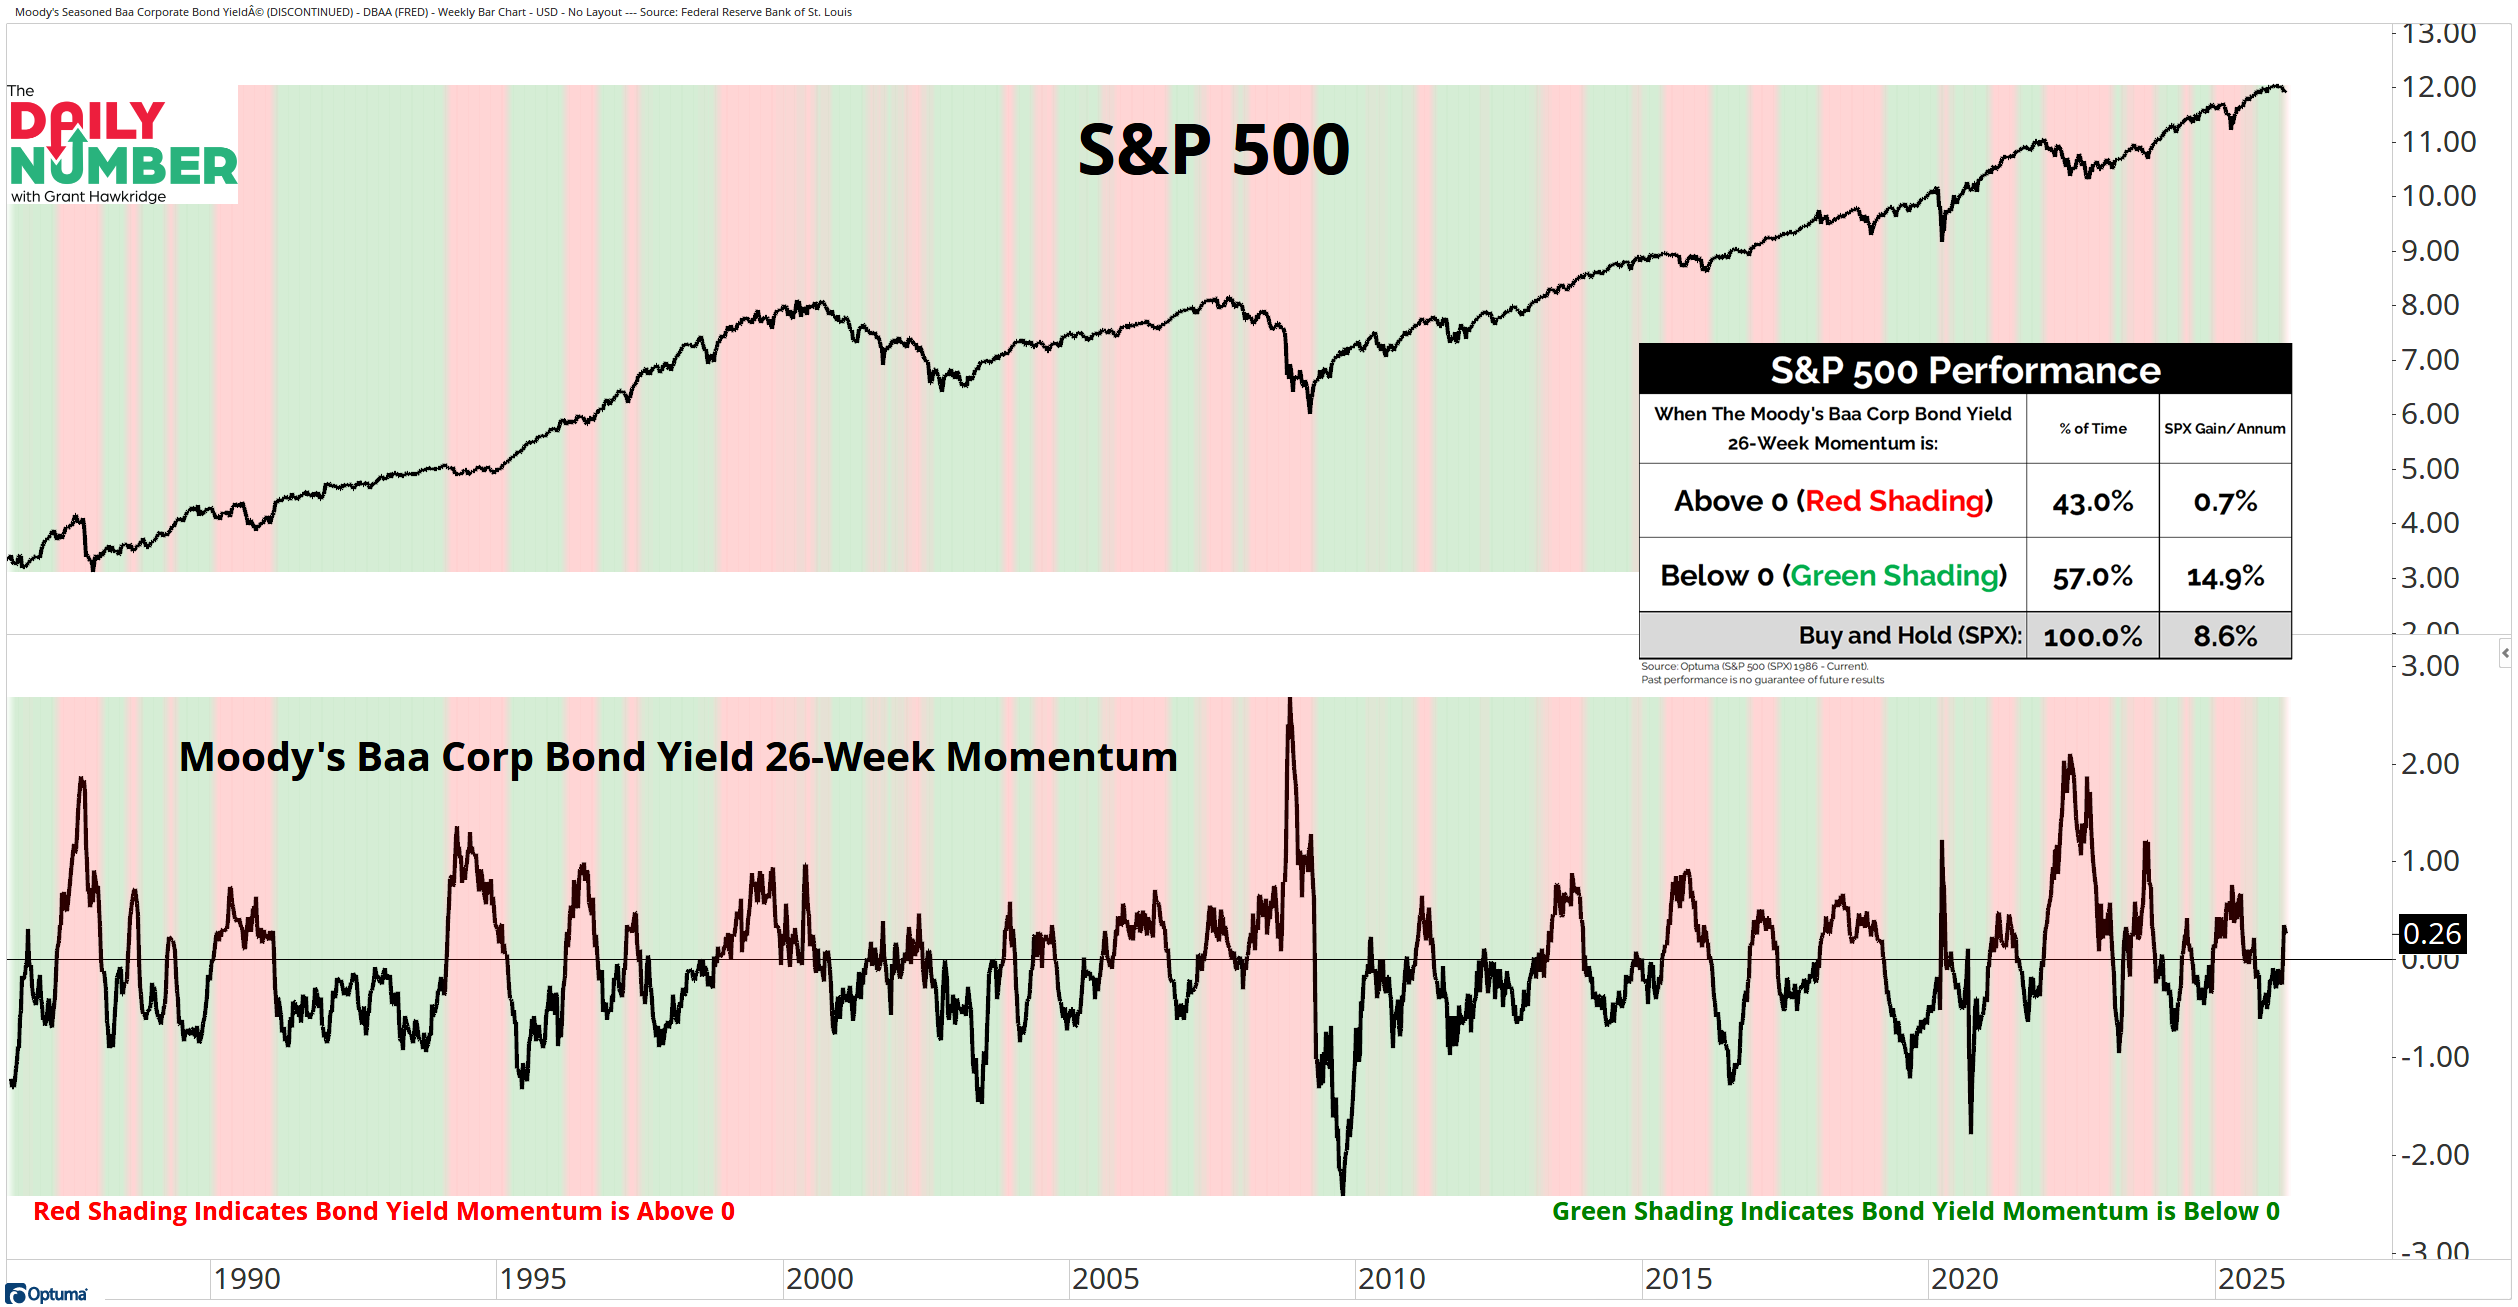
Let's break down what the chart shows:
The chart displays the S&P 500 in black in the top panel.
The lower panel displays the 26-week momentum of Moody’s Baa corporate bond yield as a black line.
Red shading appears when momentum is above zero.
Green shading appears when momentum is below zero.
A table on the right lists S&P 500 annual returns based on the shading regimes.
The Takeaway: Bond yield momentum is back above zero. That puts the market in the headwind regime.
Rising yields tighten conditions, while falling yields ease them.
The level of yields does not decide equity returns. The location of momentum does.
When yield momentum moves higher, equity returns stall. Periods in this regime deliver just 0.7% annual returns, and trends struggle to build while breakouts fail to stick.
When yield momentum moves lower, equities trend higher. Returns jump to 14.9% annualized, as pullbacks stay contained and strength builds across the market.
This spread between regimes is wide.
The favorable regime does the heavy lifting, delivering most of the market’s gains while it is only active about 57% of the time.
That is where the money is made. Right now, the signal has flipped, and the headwind is back.
So, does price push higher, stall, or move lower from here?
Grant Hawkridge | Chief Aussie Operator, All Star Charts
Steve walked through live trades in Coinbase, Amazon, Exxon, and more, including a 400% return in a matter of days. If you missed the session, the replay is up now.