9 of 11 S&P 500 sectors are trading below their 50-day moving average.
Here’s the table:
Let's break down what the table shows:
The table displays eleven sectors in rows.
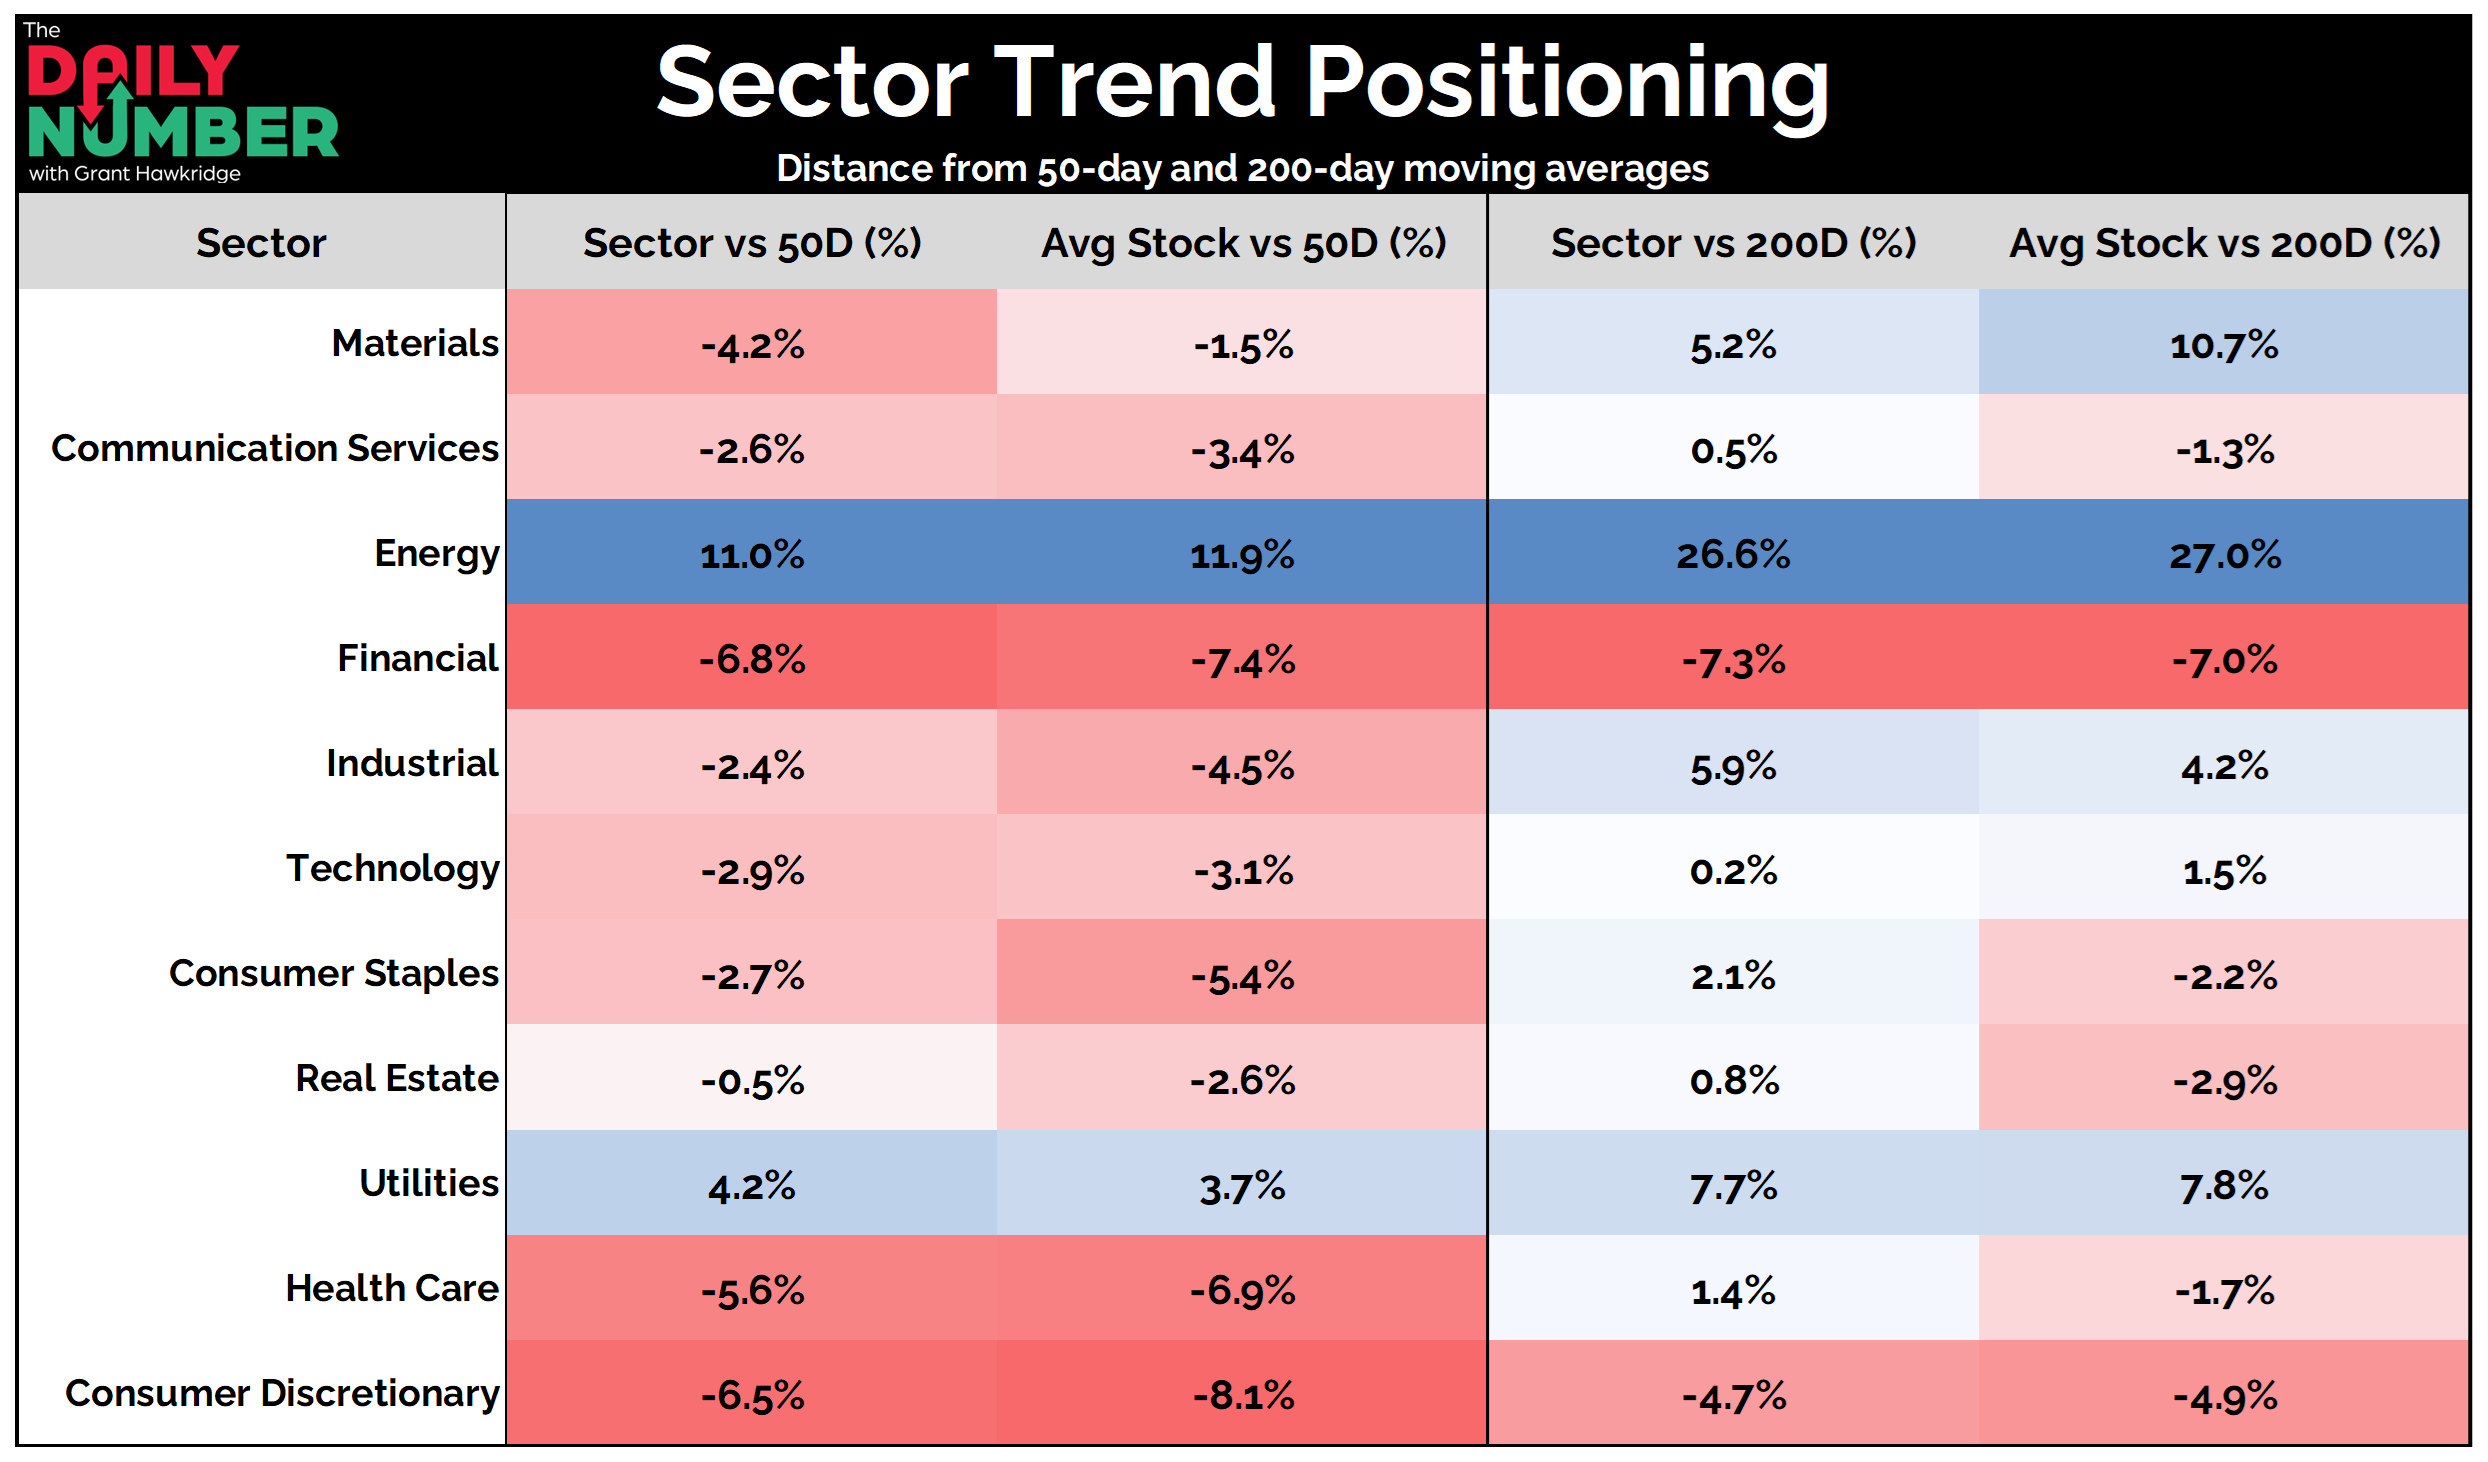
The table shows how far each sector and its average stock are trading above or below their 50-day and 200-day moving averages.
Red shading appears when values are negative.
Blue shading appears when values are positive.
The Takeaway: 9 of 11 S&P 500 sectors sit below their 50-day moving average.
Short-term trends have weakened across most of the market. This is broad pressure, not just one pocket of selling.
9 of 11 S&P 500 sectors are still above their 200-day moving average.
The longer-term uptrend still holds in many sectors. But the short-term trend has rolled over and the damage is starting to spread.
Energy is the clear outlier. It sits +11.0% above its 50-day and +26.6% above its 200-day, with the average stock even stronger at +11.9% and +27.0%.
Utilities are also above both moving averages at +4.2% and +7.7%, with the average stock confirming. Participation is strong, but it is coming from a defensive sector. That is not risk-on leadership.
Financials are weak across both timeframes at -6.8% and -7.3%. Consumer Discretionary is also under pressure at -6.5% and -4.7%, with even weaker readings at the stock level. Two key cyclical sectors are not participating. When they are both weak, upside momentum across the market usually struggles.
So, short-term trends are rolling over.
Leadership is narrow.
Energy is strong.
Utilities are holding up.
Financials and Consumer Discretionary are breaking down.
This is no longer a risk-on market.
So, is this consolidation, or the early stages of a breakdown?
Grant Hawkridge | Chief Aussie Operator, All Star Charts
Steve walked through live trades in Coinbase, Amazon, Exxon, and more, including a 400% return in a matter of days. If you missed the session, the replay is up now.