The S&P 500 just ended a 214-day streak above its 200-day moving average.
Here’s the chart:
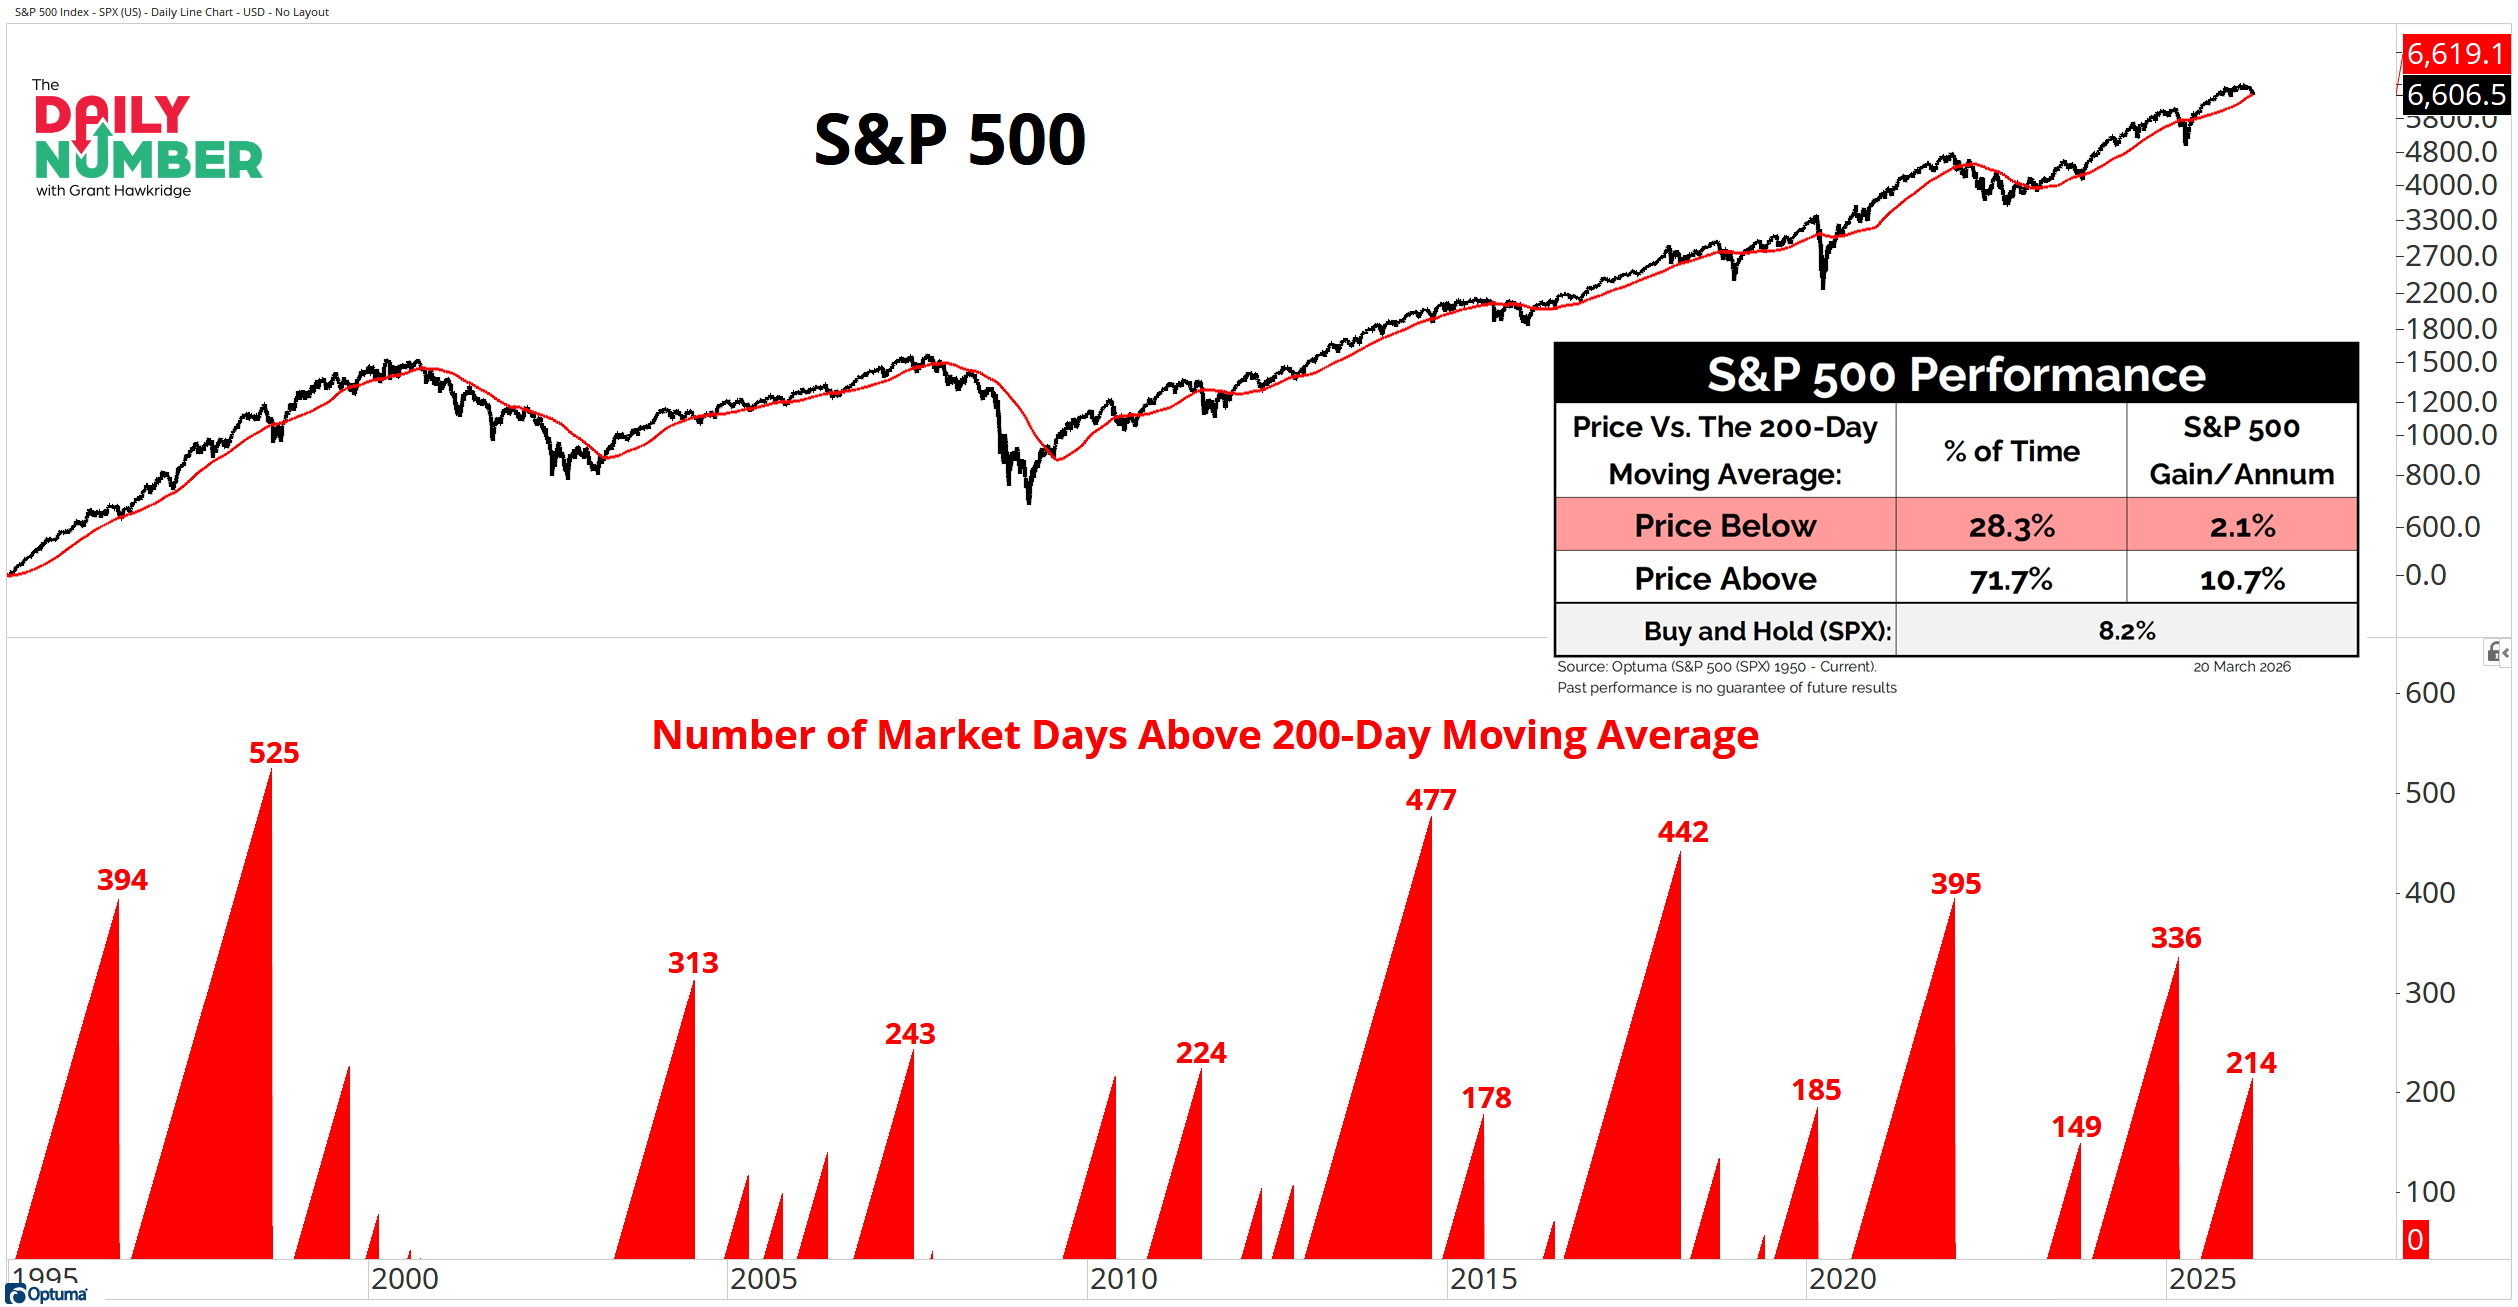
Let's break down what the chart shows:
The top panel displays the S&P 500 price in black with a red 200-day moving average.
The bottom panel displays red vertical bars representing the number of consecutive market days the index remained above the 200-day moving average.
A table on the right compares S&P 500 performance when price is above versus below the 200-day moving average, including percentage of time and annualized returns.
The Takeaway: The S&P 500 just lost its 200-day moving average after holding above it for 214 straight sessions. That run kept the market in a trend where dips got bought and price stayed supported.
That just ended.
This wasn’t a short run. The market held above the trend for 214 sessions. Breaks after runs like this tend to mark a shift in behavior rather than a quick reset.
Price has now moved from the high-return environment to the low-return environment with that close below the 200-day moving average. Above this level, the S&P 500 delivers 10.7% annual returns. Below it, that drops to 2.1%. That gap defines the market now.
One close flips the regime. Follow-through decides if it sticks. Holding below this level keeps pressure on the market.
Now, with price back below its long-term trend, the market trades differently here. Trends shorten and upside becomes harder to sustain.
So, do buyers step in here, or is this where bears take control?
Grant Hawkridge | Chief Aussie Operator, All Star Charts
Steve walked through live trades in Coinbase, Amazon, Exxon, and more, including a 400% return in a matter of days. If you missed the session, the replay is up now.