The S&P 500’s 14-day RSI just dropped below 30 and now sits at 29.9, flipping the RSI Momentum Regime to bearish.
Here’s the chart:
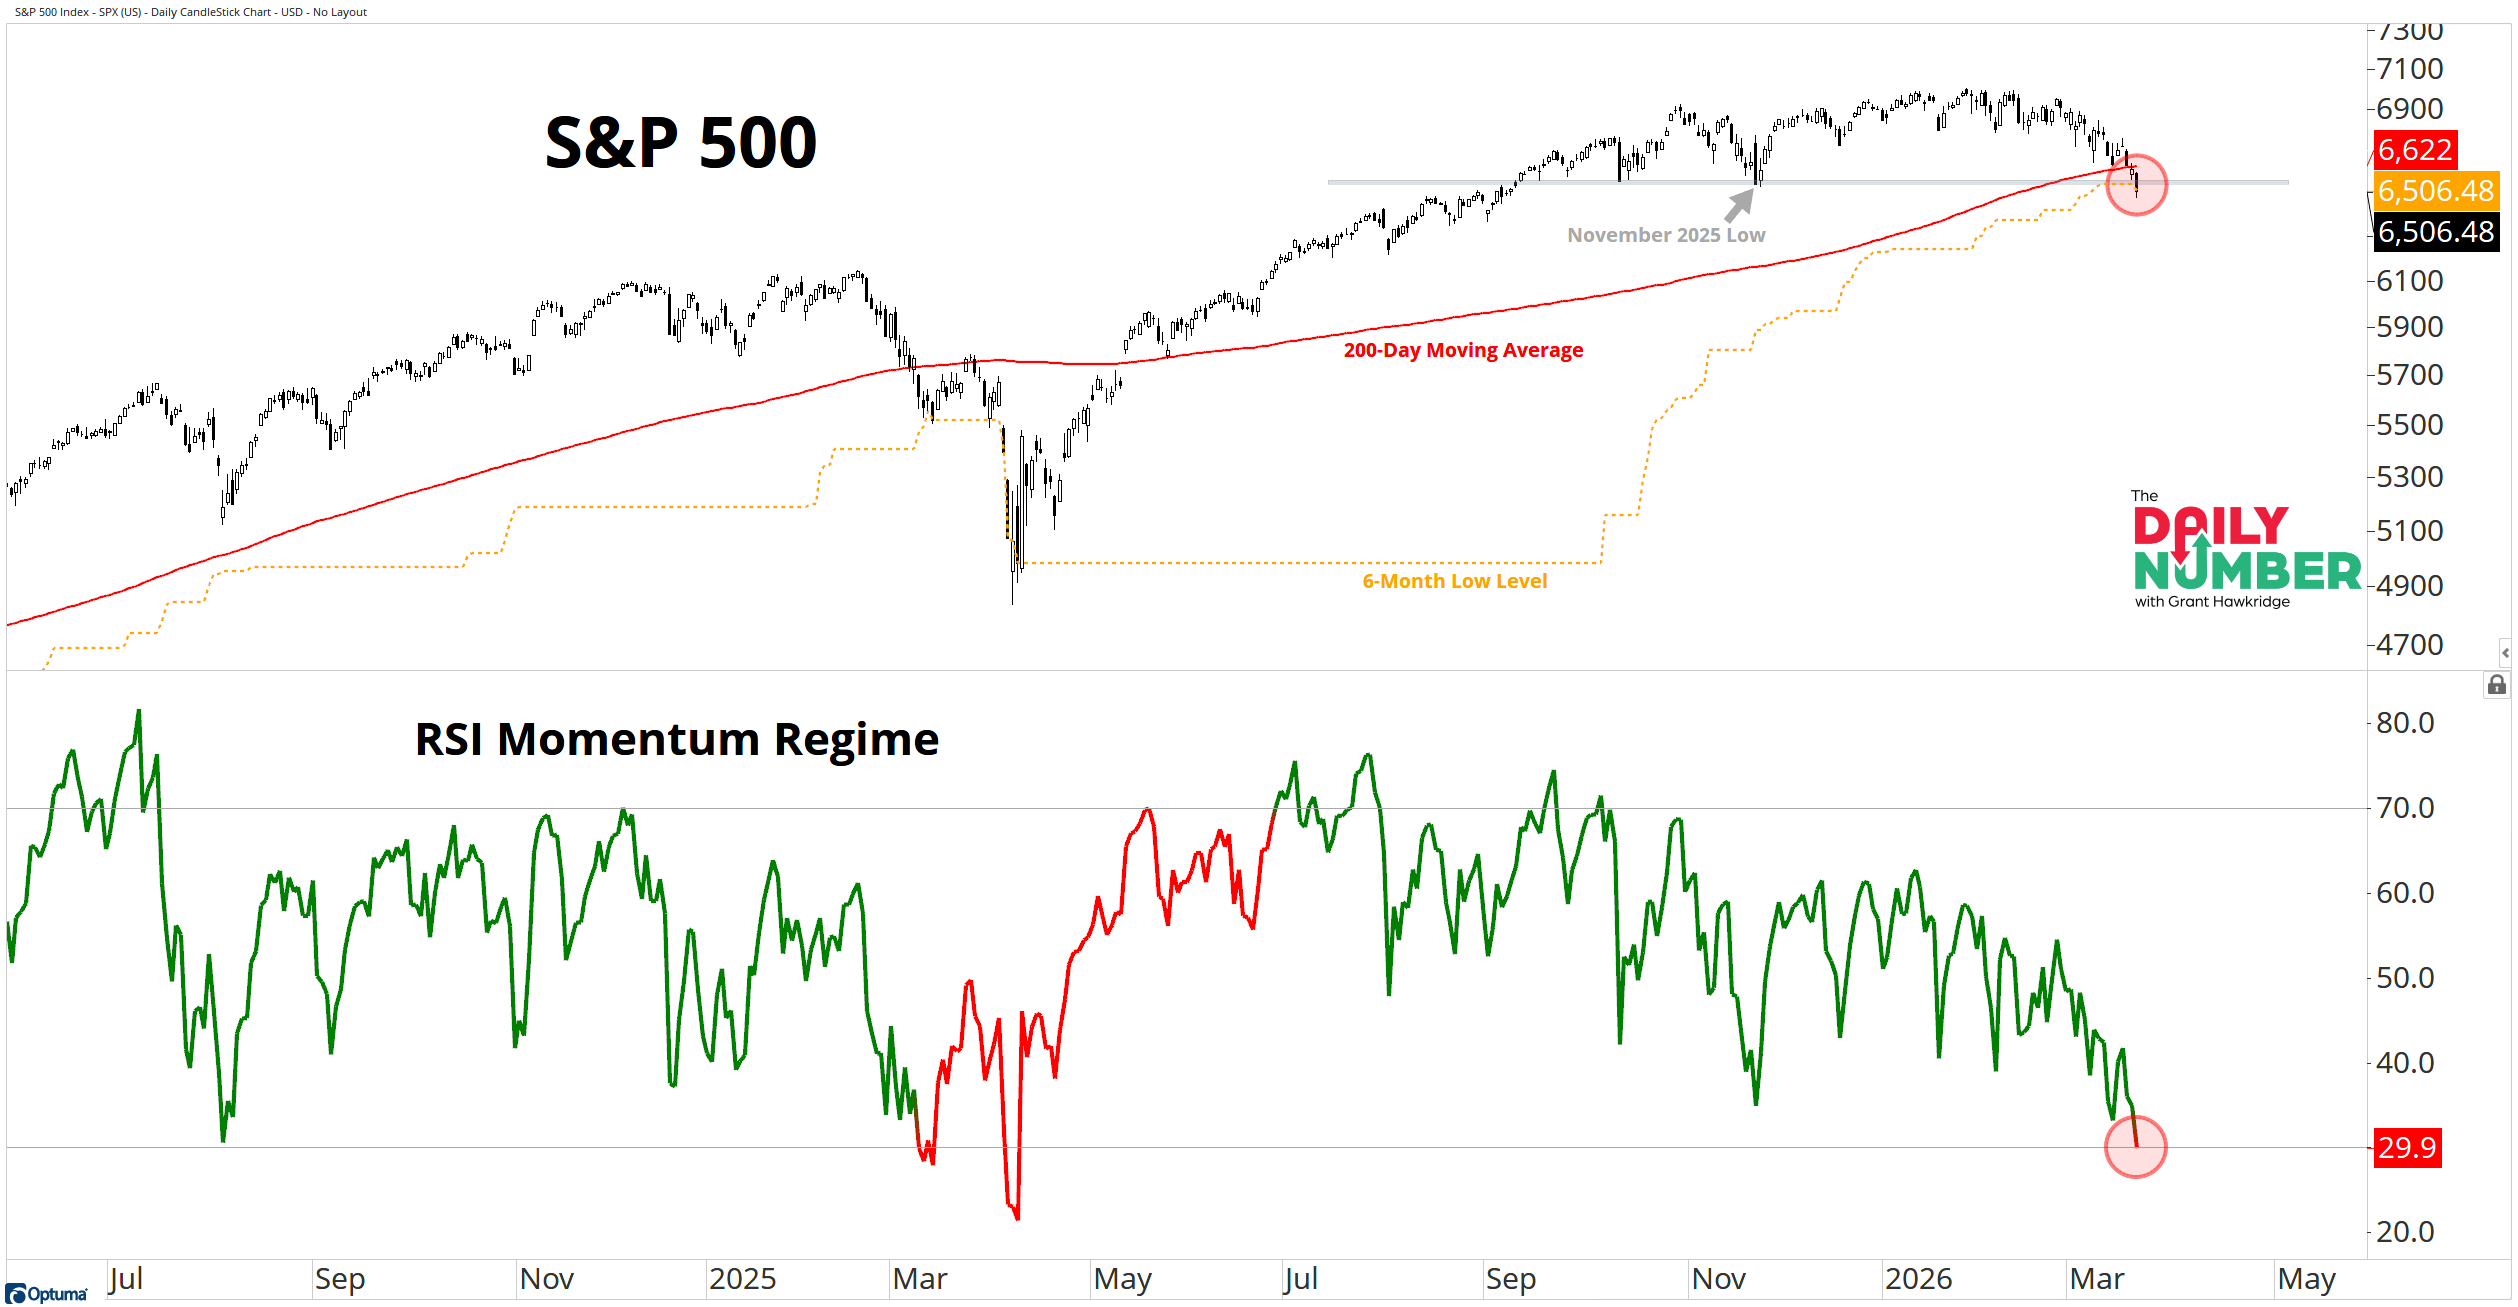
Let's break down what the chart shows:
The top panel displays the S&P 500 price as black candlesticks.
A red line marks the 200-day moving average.
A grey horizontal line marks the November 2025 low.
A dashed orange line marks the six-month low level.
The lower panel displays the 14-day Relative Strength Index.
Green appears when RSI is in the bullish regime.
Red appears when RSI is in the bearish regime.
Horizontal lines mark the 70 and 30 RSI levels.
The Takeaway: The RSI Momentum Regime has now flipped bearish.
The previous bullish regime began when RSI pushed above 70, and that regime held through every pullback during the most recent advance. The drop below 30 completes the full momentum cycle from upside extreme to downside extreme, which is the condition required for this model to change regimes.
Bull markets usually keep RSI above 30 during corrections. Momentum cools during pullbacks, but it does not fully reset. That pattern kept the bullish regime intact throughout the advance as dips stopped before the indicator reached the oversold threshold.
That changed this week.
The move below 30 shows sellers have pushed momentum far enough to complete the cycle. The model now resets and the regime has now flipped to bearish mode.
Price weakness is occurring at the same time.
The S&P 500 is trading below its 200-day moving average, below the support level that held in November 2025, and is now trading at a six-month low.
Momentum and price deterioration are now moving together.
The only way to flip the regime back to bullish is for RSI to climb all the way back to 70.
So, does momentum rebuild fast, or does this bearish regime stick around?
Grant Hawkridge | Chief Aussie Operator, All Star Charts
Need a full trading toolkit that actually helps you make moves? All Star Charts Premium gives you daily trade ideas, proprietary scans, and access to our entire analyst team. If you're serious about leveling up your strategy, start here.