More Than One Third of the Market Is in a Bear Market 📉
By Grant Hawkridge
March 24, 2026
Today's number is... 38.4%
38.4% of S&P 500 stocks are down 20% or more from their 52-week highs.
Here’s the chart:
Let's break down what the chart shows:
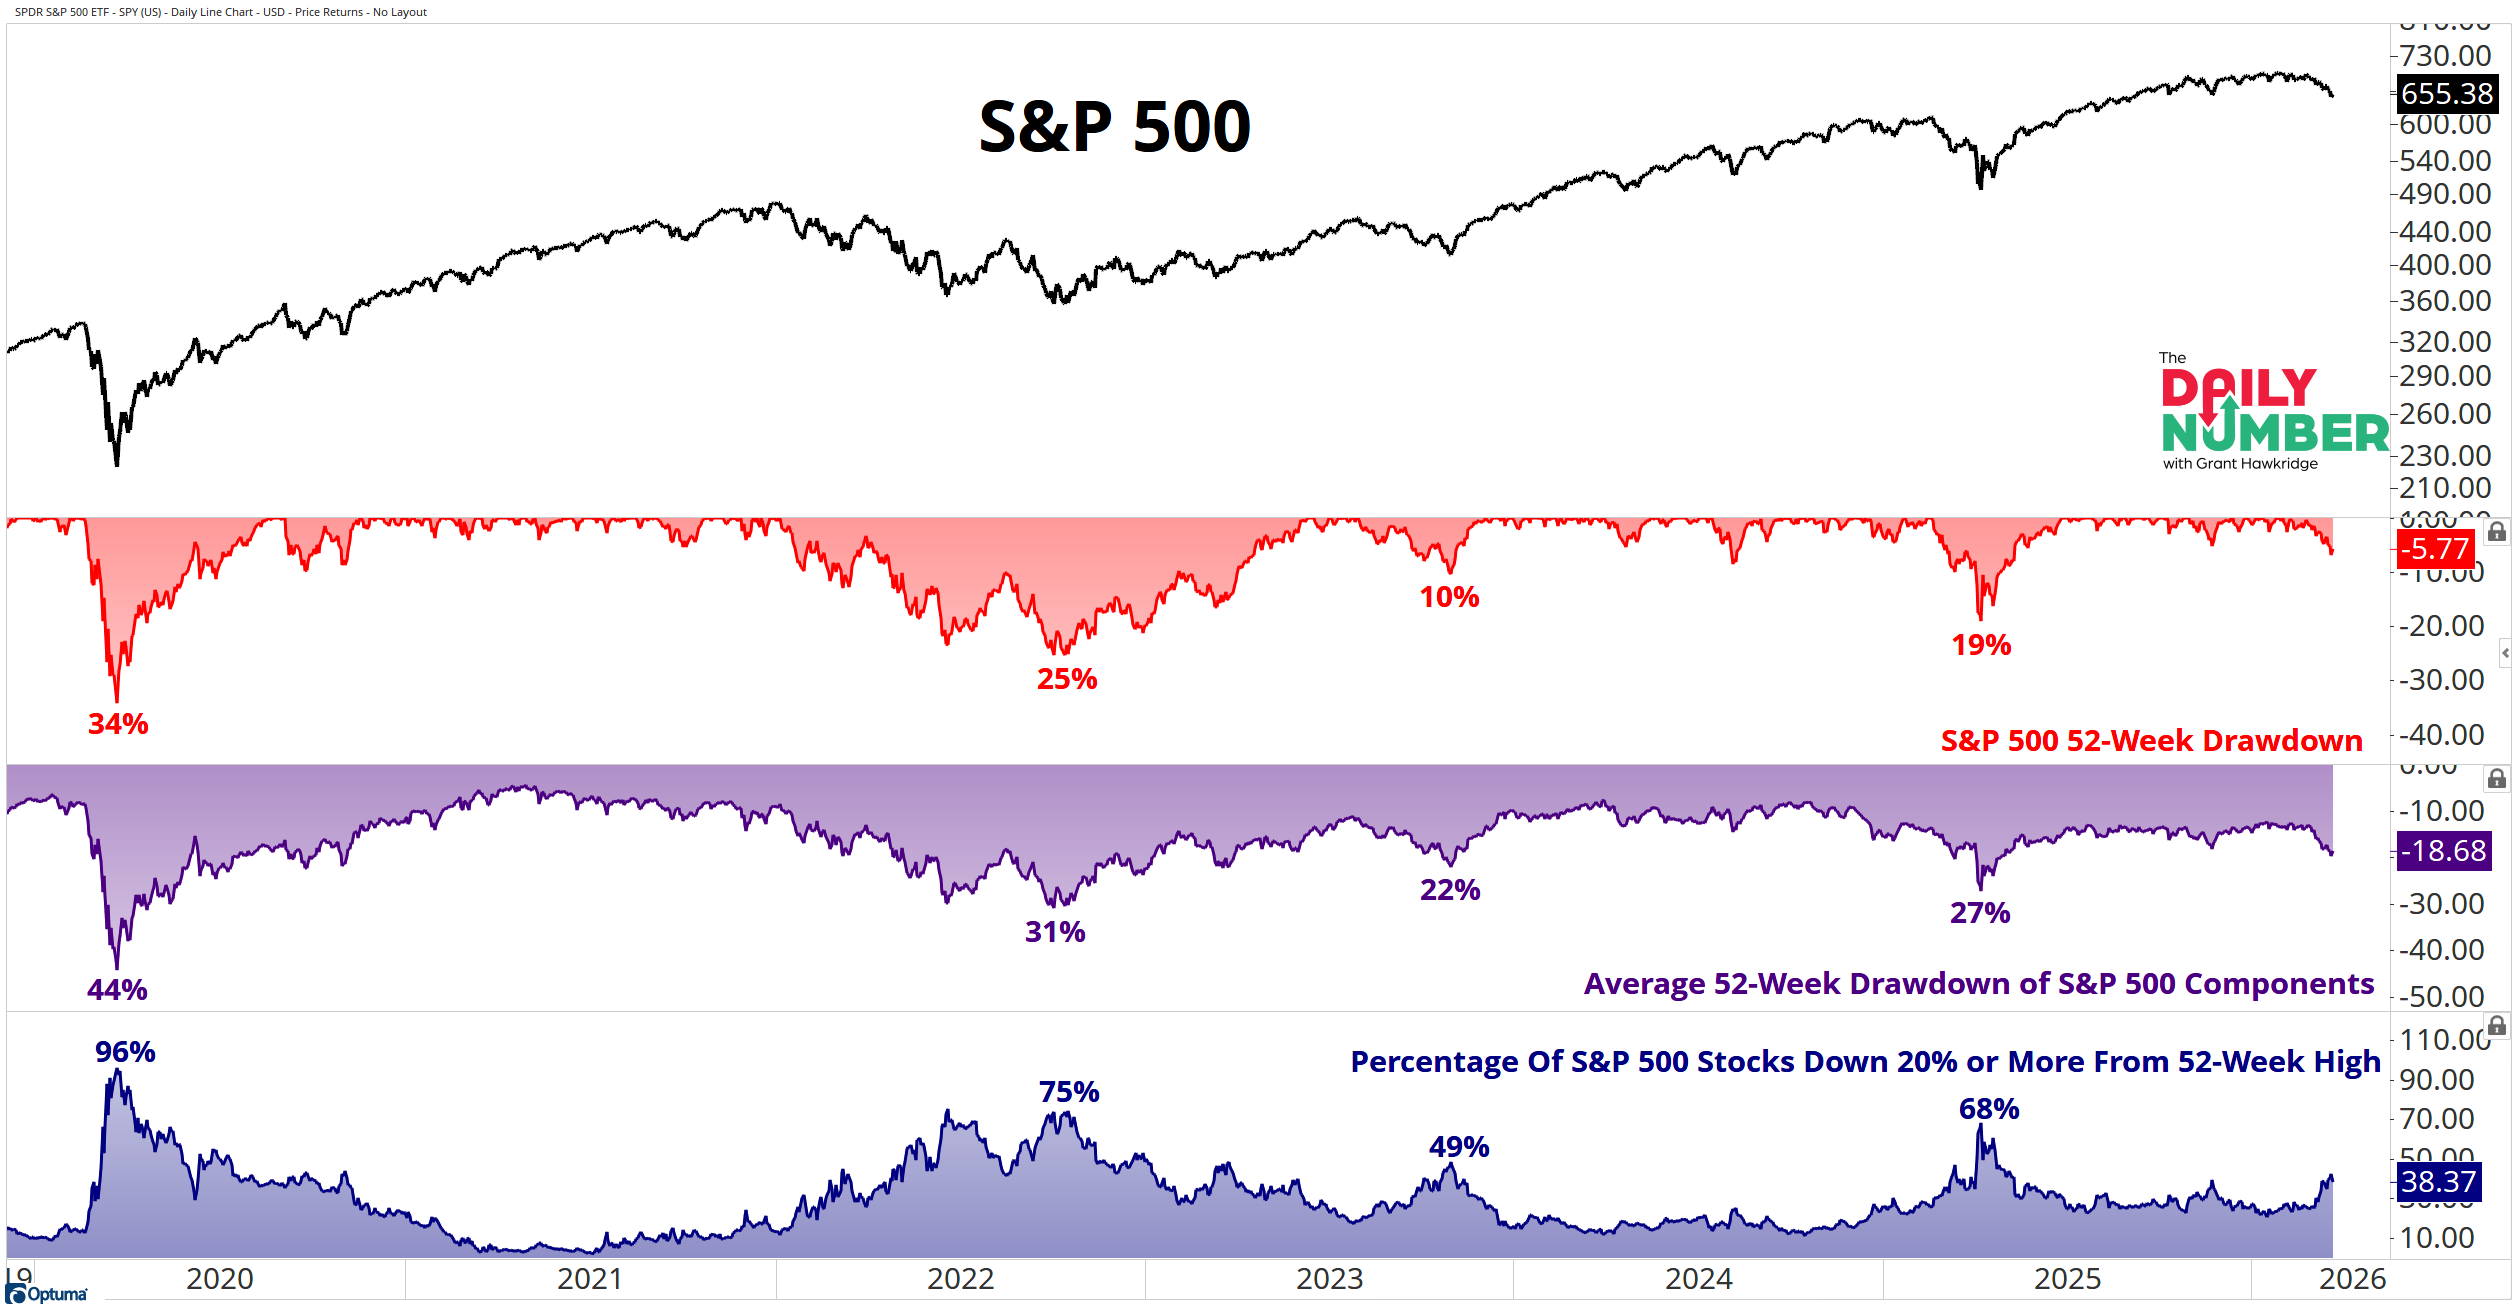
The top panel displays the S&P 500 price as a black line.
The second panel displays the S&P 500’s percentage drawdown from its 52-week high as a red line.
The third panel displays the average 52-week drawdown of S&P 500 components as a purple line.
The bottom panel displays the percentage of S&P 500 stocks trading 20% or more below their 52-week high as a blue line.
The Takeaway: 38.4% of S&P 500 stocks are already down more than 20% from their highs.
That puts more than one-third of the index in bear market territory. Meanwhile, the S&P 500 sits only 5.8% below its all-time high. That may sound calm, but the average stock would disagree.
The average S&P 500 stock is already down 18.7% from its high. Many stocks are already deep in a correction, while the index still sits close to its peak.
Breadth deteriorates long before the index rolls over. That pattern shows up again and again during market pullbacks. A large share of the market has already absorbed the damage. The index has not yet.
But sometimes markets resolve setups like this through time instead of price. The index moves sideways while individual stocks work through the selling pressure underneath.
So what happens next…. Do stocks recover from here, or does the index finally catch down to the internals?