One quarter of the year is finished, and the S&P 500 sits at –3.9% for 2026 so far.
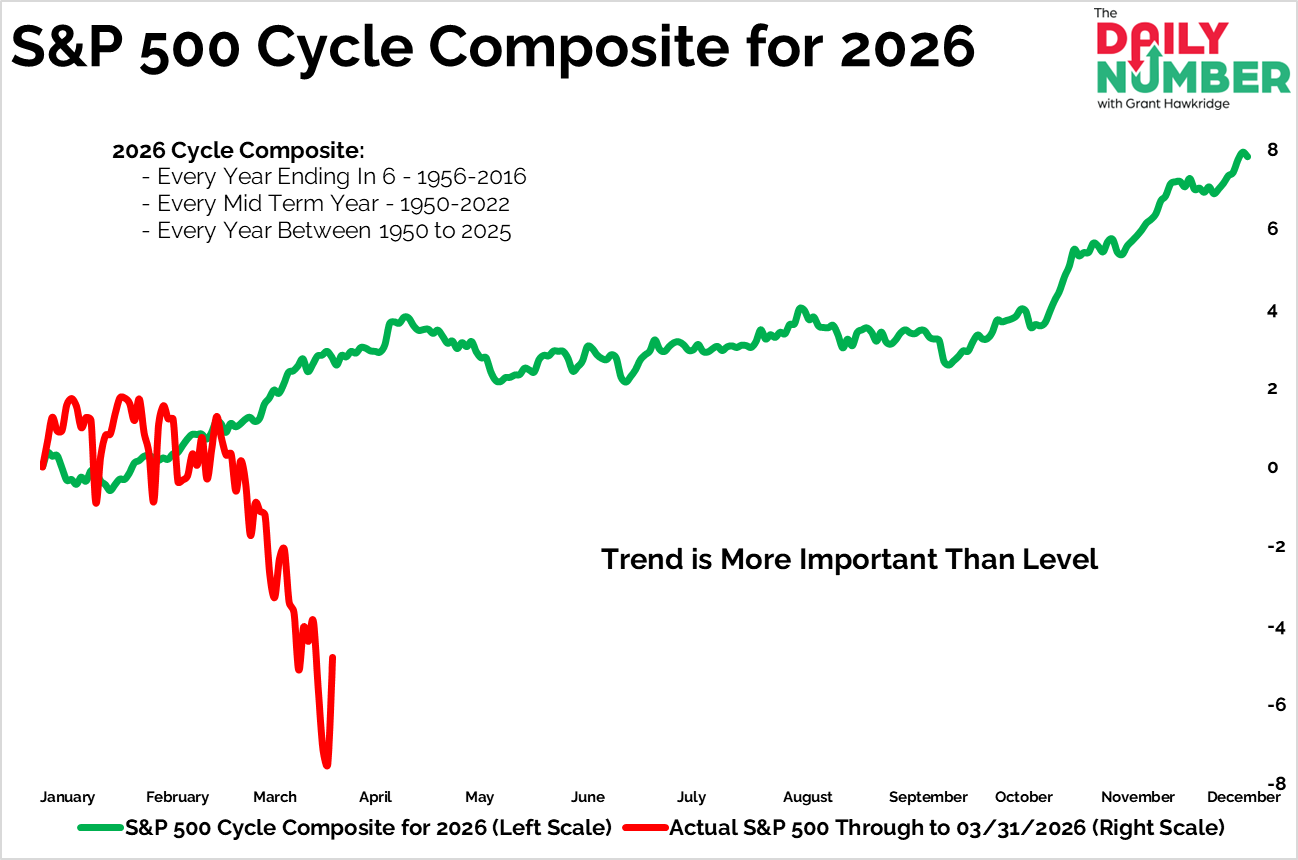
Here’s the chart:
Let's break down what the chart shows:
The chart displays a green line representing the S&P 500 cycle composite for 2026.
The composite is built from three historical groups: years ending in six from 1956–2016, midterm election years from 1950–2022, and the average calendar-year path for the S&P 500 from 1950–2025.
A red line displays the actual S&P 500 performance through March 31, 2026.
The Takeaway:One quarter of the year is finished. The S&P 500 is down –3.9% in 2026.
The seasonal cycle pointed the other way.
The market did the opposite.
Price drifted sideways through January and February, then sold off hard through March. The gap between the historical path and the actual market widened quickly in the final weeks of the quarter.
The seasonal trend usually begins improving in February and continues strengthening through March. This year, the opposite happened. Selling accelerated during a normally stronger seasonal period.
Now the calendar flips to April. That month ranks among the strongest of the year for the S&P 500. The cycle composite also carries a seasonal tailwind during this stretch.
Historically, the cycle tends to peak around the start of May. After that, the market often grinds sideways through the summer before a stronger advance into year end.
Q1 traded against the seasonal cycle.
April now becomes the next test.
So, does April pull the market back to the seasonal path, or is 2026 trading its own script?
Grant Hawkridge | Chief Aussie Operator, All Star Charts
Jason Perz just went live and walked through the commodity rotation pattern that's played out every decade for 50 years, and where it's pointing right now. The replay is available now.