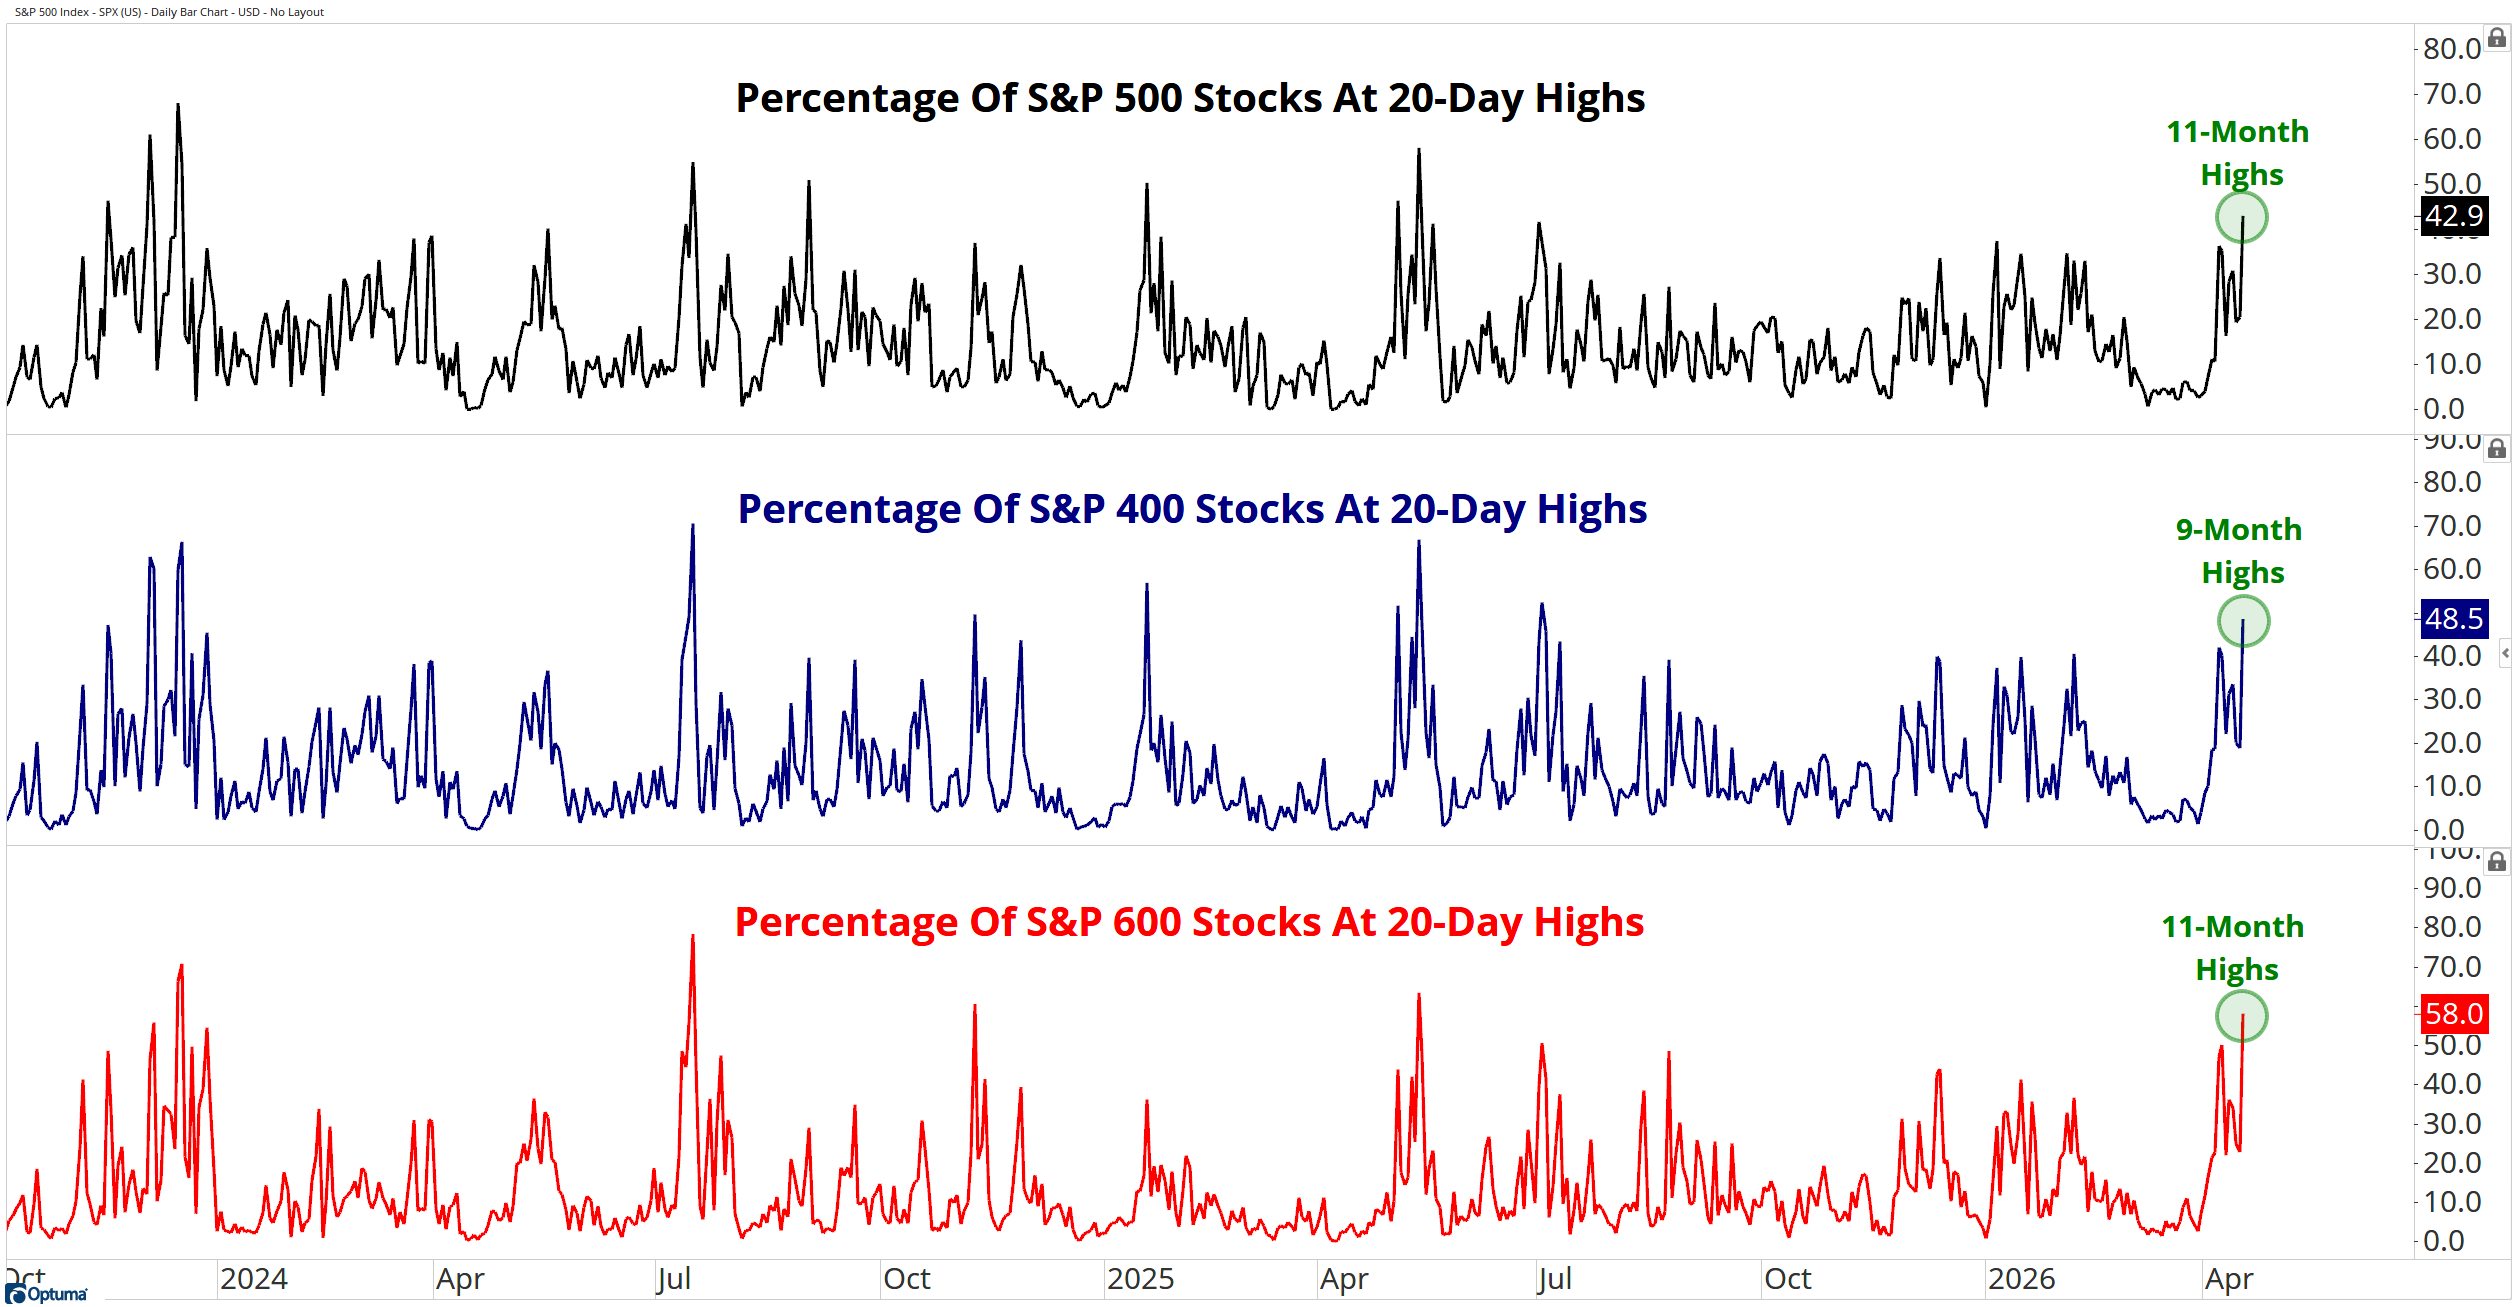
20-day highs are surging, with 58% of small caps, 48% of mid caps, and 43% of large caps pushing to fresh short-term highs.
Here’s the chart:
Let's break down what the chart shows:
The chart displays three lines showing the percentage of stocks at 20-day highs for the S&P 500 in black, the S&P 400 in blue, and the S&P 600 in red.
The Takeaway: 20-day highs are expanding across the entire market. Small-cap breadth is at 58%, mid-cap breadth is at 48%, and large-cap breadth is at 43%. All three are pushing to multi-month highs at the same time.
Small-cap breadth is leading. That is where risk shows up first when conditions are improving. More than half of small-cap stocks are making short-term highs. That is aggressive buying.
Mid-cap breadth is right behind it. Nearly half of the stocks are pushing to highs. That adds depth. This is not a handful of names driving things.
Large-cap breadth is confirming. It is not leading, but it is moving in the same direction. That keeps the move intact.
All three breadth measures are rising together. This is broad expansion across the market cap spectrum.
This is the type of move that puts breadth thrusts on watch. I have not seen a full thrust signal across everything I track yet. But this is how it starts. You get a surge like this, then you look for it to build.
Now it comes down to follow-through. We need to see more stocks push to highs this week. If participation expands from here, this could become a confirmed thrust.
Breadth is expanding fast. Now it needs to keep pushing higher!
Grant Hawkridge | Chief Aussie Operator, All Star Charts
The 2-to-100 scanner runs every week through small-cap names off fresh 52-week highs - before they show up in broader coverage. Rick Sarraf cuts it to one pick. Entry, target, done. $199 for the year.