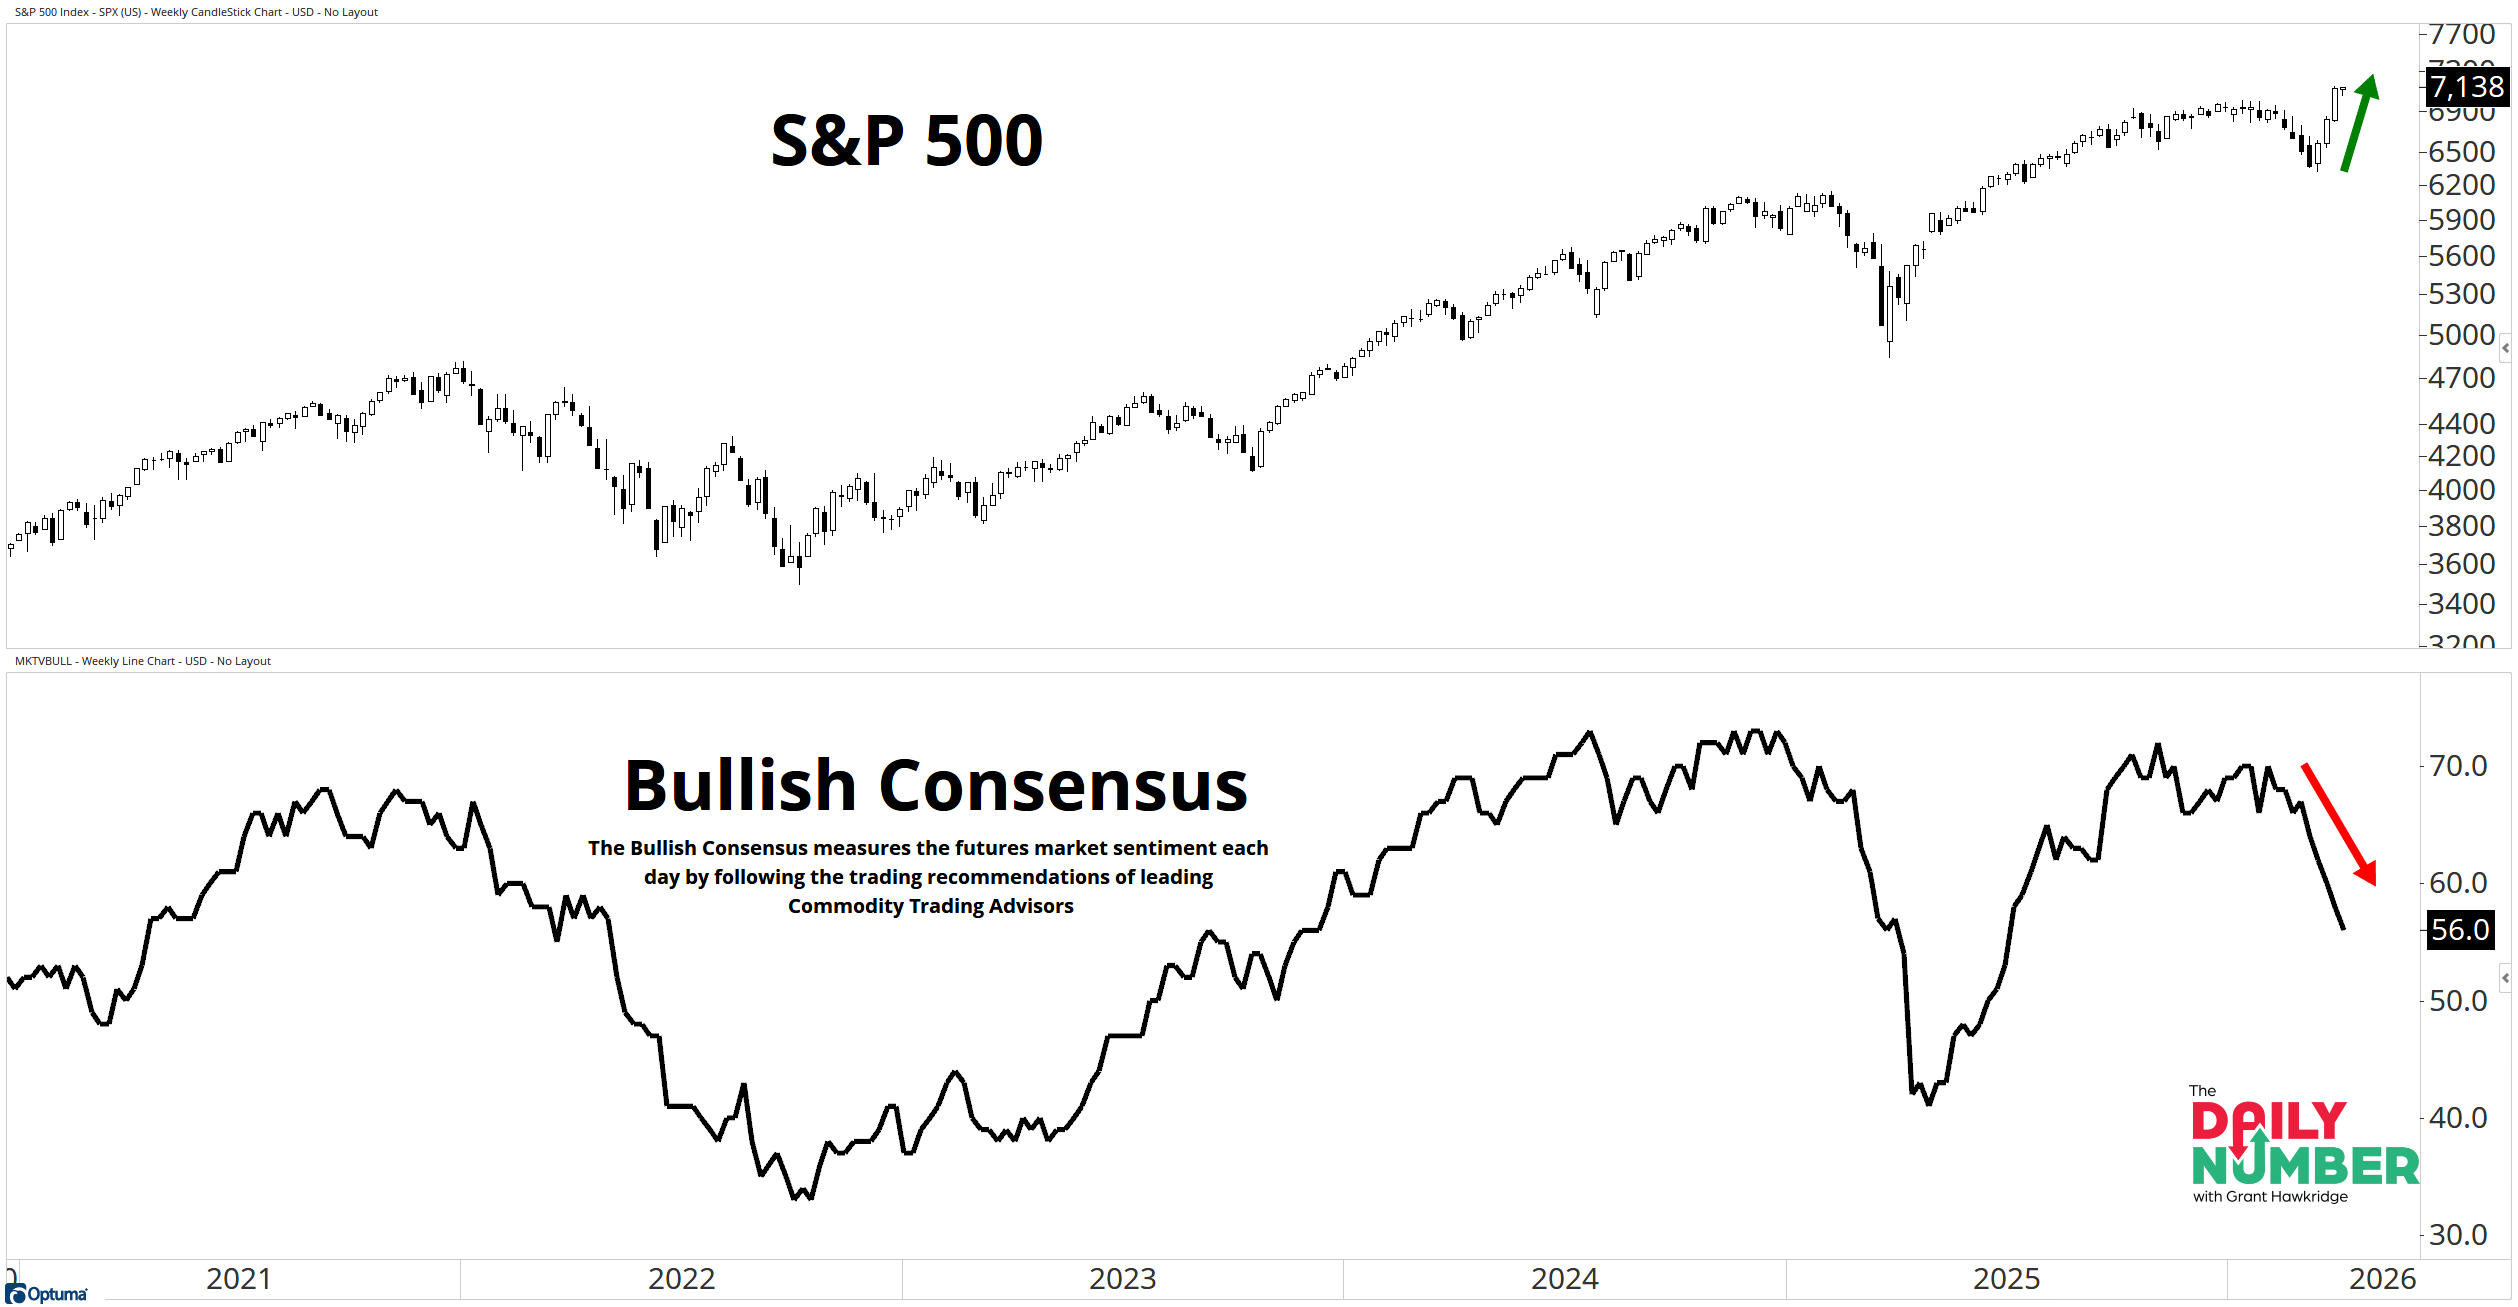
Bullish Consensus is at 56, sitting mid-range while the S&P 500 pushes back to all-time highs.
Here’s the chart:
Let's break down what the chart shows:
The top panel displays a weekly candlestick chart of the S&P 500 in black.
The bottom panel shows a black line representing Bullish Consensus, which tracks sentiment from futures traders.
The Takeaway: Bullish Consensus at 56 is not a bullish extreme.
It sits right in the middle of the range while the S&P 500 is trading at all-time highs, which tells you the crowd is still hesitant, not optimistic.
Mid-range sentiment like this does not give you an edge. There is no panic to buy and no excess optimism to fade, so sentiment is not the driver here, and you need to look somewhere else.
That brings you back to price, and price is at highs. The trend is moving higher and continuing to work, which is what matters when sentiment is neutral.
At the same time, the crowd still has not bought into the move. Sentiment has not pushed back to prior highs, even as price has, which tells you people are involved but not fully convinced.
That is not how market tops form. Tops show up when the crowd is fully committed and sentiment is stretched, not when there is still doubt sitting under the surface.
This is a bull market, and you treat it that way. Price is strong and sentiment is not stretched. That is the setup you want if you are looking for higher prices.
As long as sentiment stays contained and price keeps making higher highs, the path remains higher. The crowd is not all-in yet. And until they are, this trend has more upside.
Grant Hawkridge | Chief Aussie Operator, All Star Charts
The 2-to-100 scanner runs every week through small-cap names off fresh 52-week highs - before they show up in broader coverage. Rick Sarraf cuts it to one pick. Entry, target, done. $199 for the year.