The Market Just Entered Its Most Dangerous Seasonal Window ⚠️
By Grant Hawkridge
May 15, 2026
Today's number is... 4
This is usually the point in the mid-term cycle when it starts becoming much more challenging for investors. Historically, May has often marked the beginning of one of the weakest and most volatile stretches of the entire 4-year cycle.
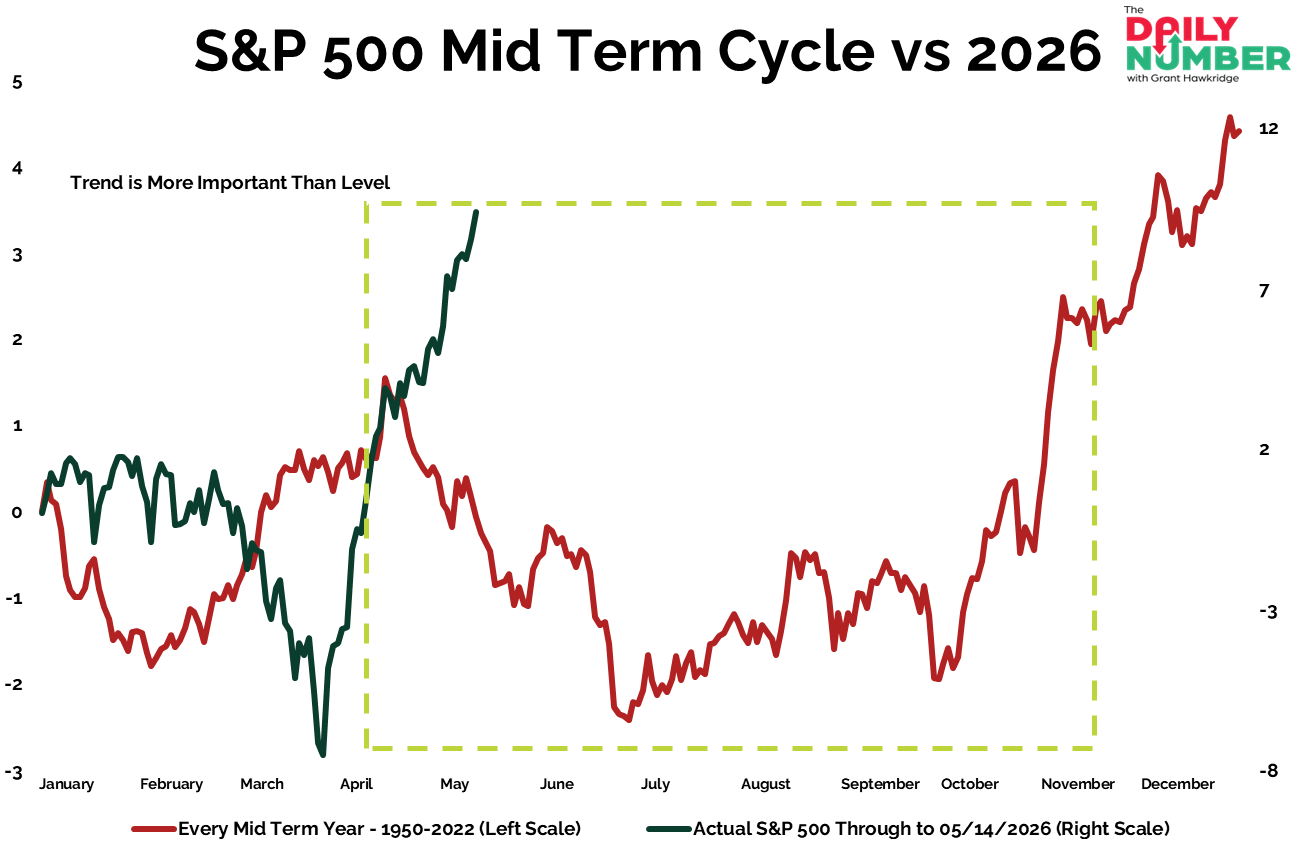
Here’s the chart:
Let's break down what the chart shows:
The chart compares the average S&P 500 path during mid-term years since 1950 in red against the actual 2026 S&P 500 path in dark green.
The light green dashed box highlights the period where the historical mid-term cycle has typically weakened.
Today’s chart makes the timing of that signal a lot more interesting.
Historically, this is right around where the market cycle usually starts becoming much more difficult during mid-term years. The first few months of the year are often strong.
Then the environment changes.
Volatility starts picking up. Trends stop moving as smoothly. Markets become less forgiving. And the easy upside that worked earlier in the year usually becomes harder to find.
That does not mean the market has to roll over here.
And honestly, that is what makes this setup so fascinating right now.
The actual 2026 path is still running much stronger than the historical cycle average. Price is still near the highs. Bulls still control the trend. If you only looked at the index, you would probably think everything still looks perfectly healthy.
But yesterday’s Breadth Thrust expiration already told us something important changed beneath the surface.
One of the market’s strongest historical tailwinds just quietly rolled off the clock at the exact same time the calendar cycle is entering one of its weakest historical windows.
That gets my attention.
I’m not looking to blindly turn bearish because of one signal or one seasonal pattern. That is not how I trade.
But I am becoming a lot more selective here.
I want to see whether the market can keep expanding higher with strong participation underneath the surface. I want to see whether buyers keep showing up across the board.
Because historically, this is usually where the market starts separating the strong trends from the exhausted ones.
The next few months are where bull markets usually stop feeling easy, and start proving whether they are actually strong.
Grant Hawkridge | Chief Aussie Operator, All Star Charts
Steve Strazza is hosting a free live training on Monday, May 18th at 4:30 PM ET.
The Fast Money Masterclass. He's walking through the proprietary indicator behind 14 doubles in 20 trades last month, and the simple strategy any investor can use to find trades that could 3x, 5x, even 10x in just a few days.