The S&P 500 Is Moving Together Less Than Ever Before 🔄
By Grant Hawkridge
July 9, 2026
Today's number is... 0.16
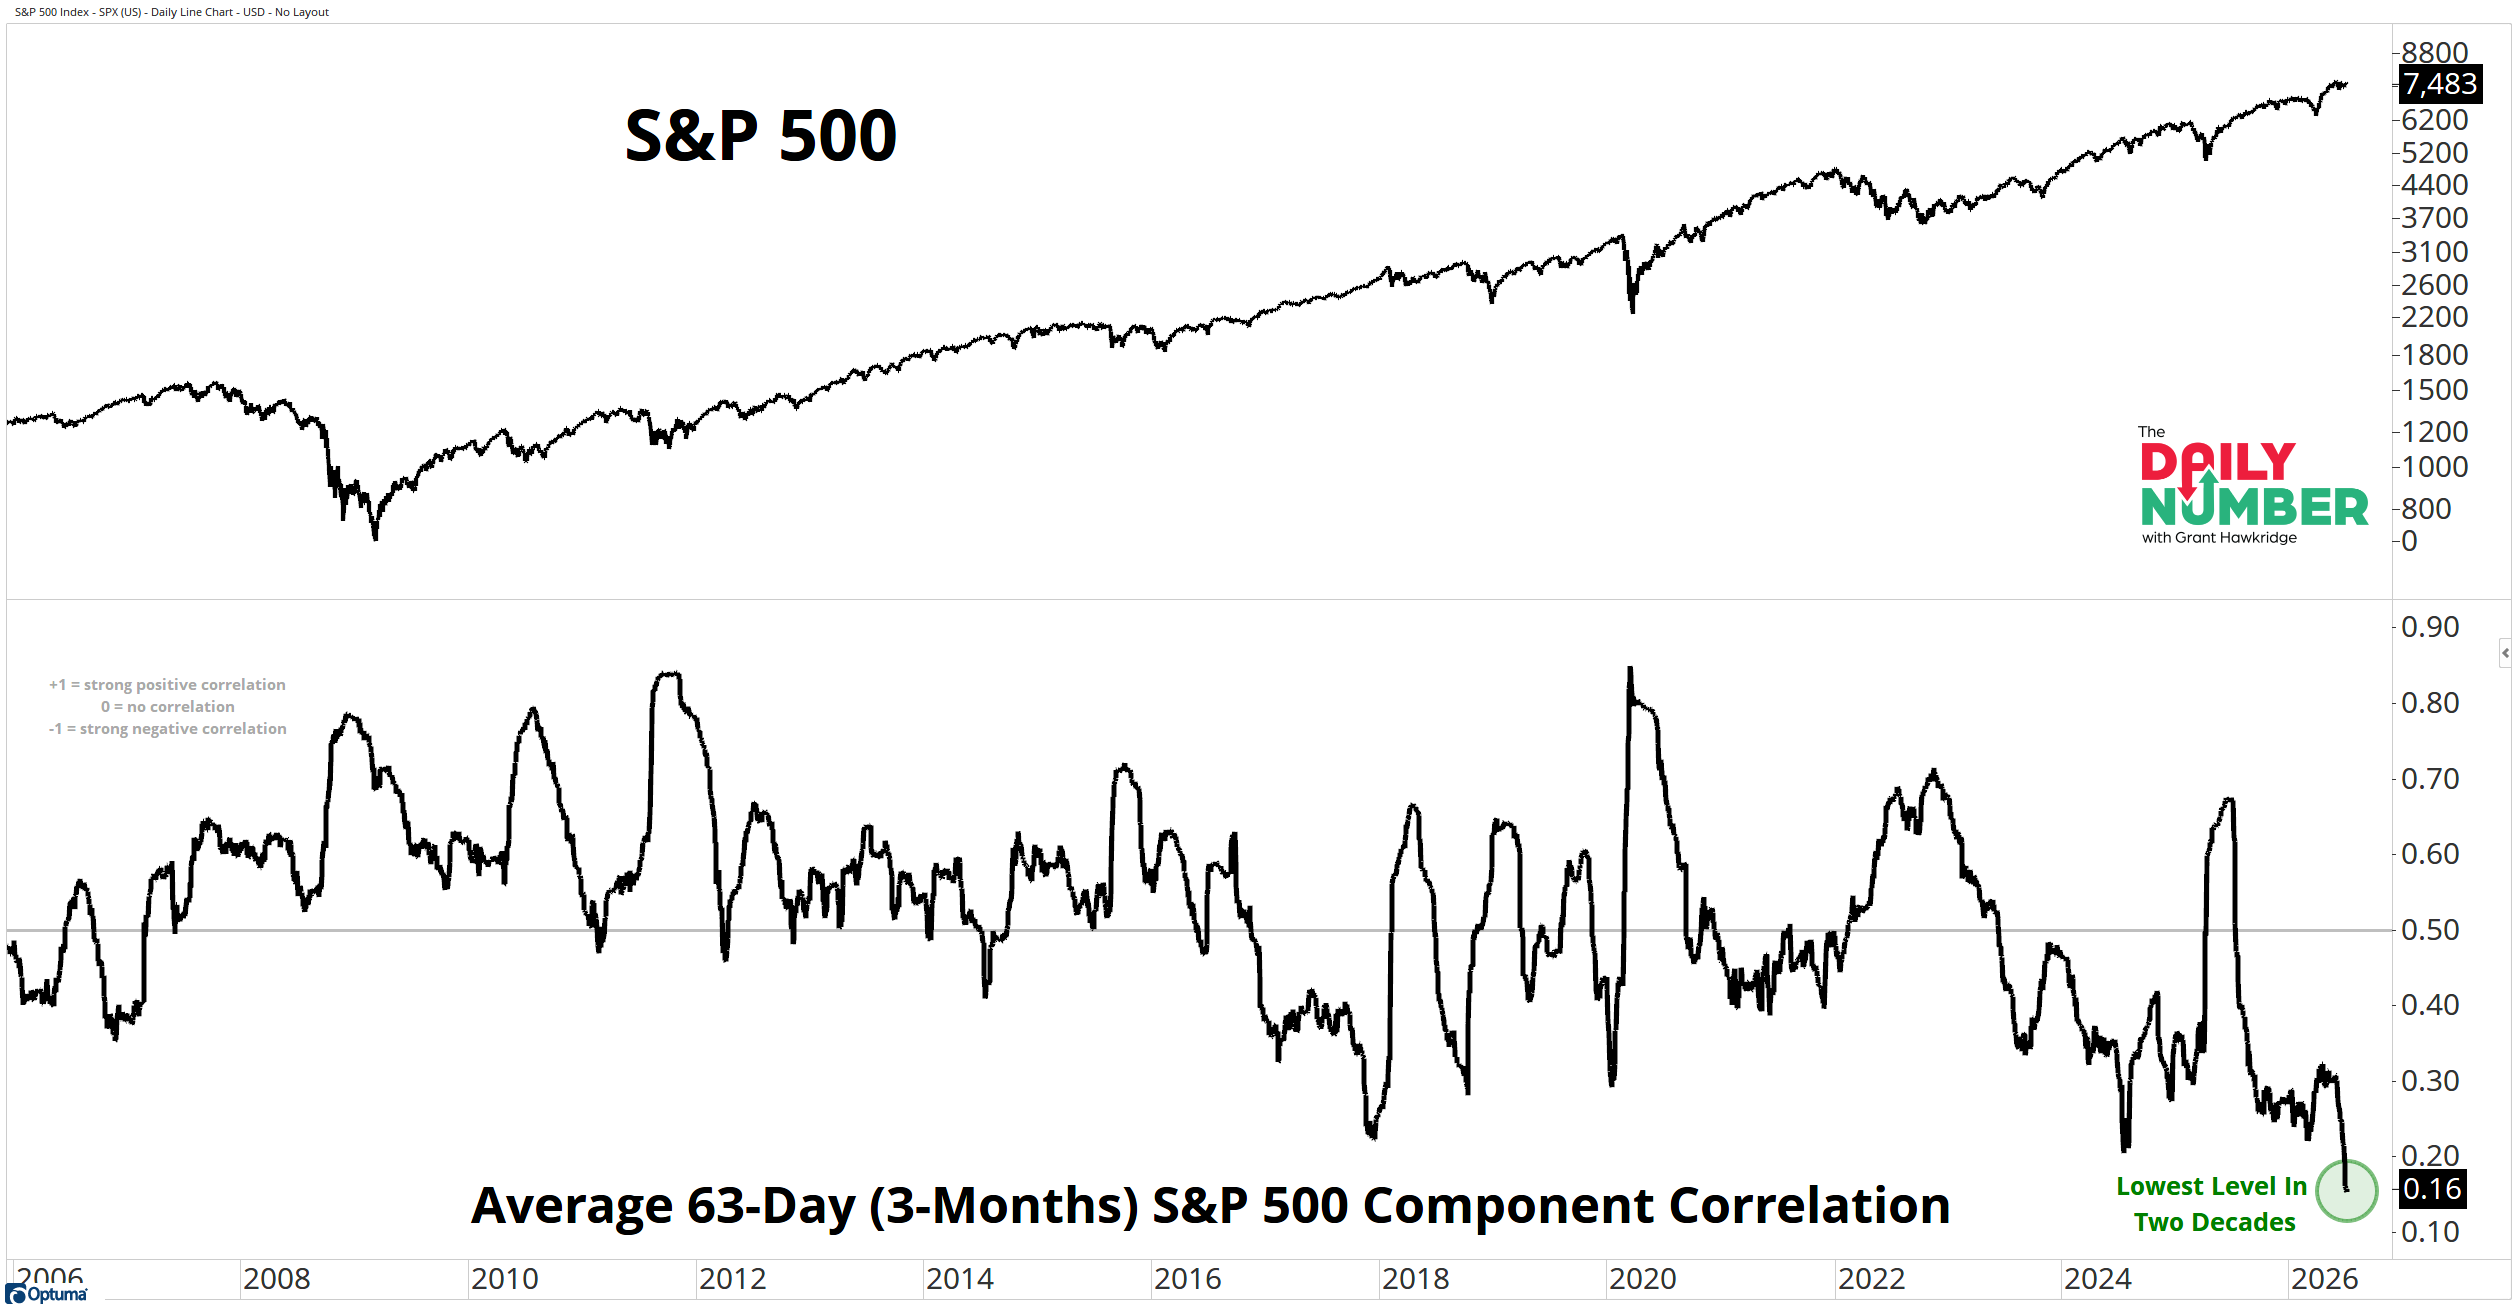
The average 63-day correlation between S&P 500 components has fallen to 0.16, its lowest level in more than two decades.
In plain English, stocks inside the S&P 500 are behaving far more independently from one another than usual.
Here’s the chart:
Let's break down what the chart shows:
The top panel shows the S&P 500 in black.
The lower panel shows the average 63-day correlation between S&P 500 components in black.
The Takeaway: A reading of 0.16 means S&P 500 stocks are doing their own thing.
Some are rising. Others are falling.
Different sectors and industries are following their own trends. The market is not moving as one big group, and that creates greater separation between the winners and losers.
One reason correlation can fall is sector rotation.
Money moves from one area of the market to another. Technology may pause while financials improve. Industrials may strengthen while another group cools off. That constant movement of money is the lifeblood of a healthy bull market. Not every stock needs to rise at the same time. The market just needs enough fresh leadership to keep the advance going.
The opposite tends to happen during market weakness. When investors get nervous, they often stop distinguishing between individual companies. Good stocks get sold with bad stocks. Strong sectors get dragged down with weak ones. That is why some of the biggest spikes in correlation came during periods of market stress, including 2008, 2020 and 2022.
For stock pickers, low correlation creates opportunity. When stocks are moving independently, leadership and relative strength become more important. You cannot simply own anything and expect the market to carry it higher. You need to know where money is actually flowing.
For me, the message from this chart is simple. When correlations are this low, the market becomes more selective. And in a selective market, what you own matters even more.