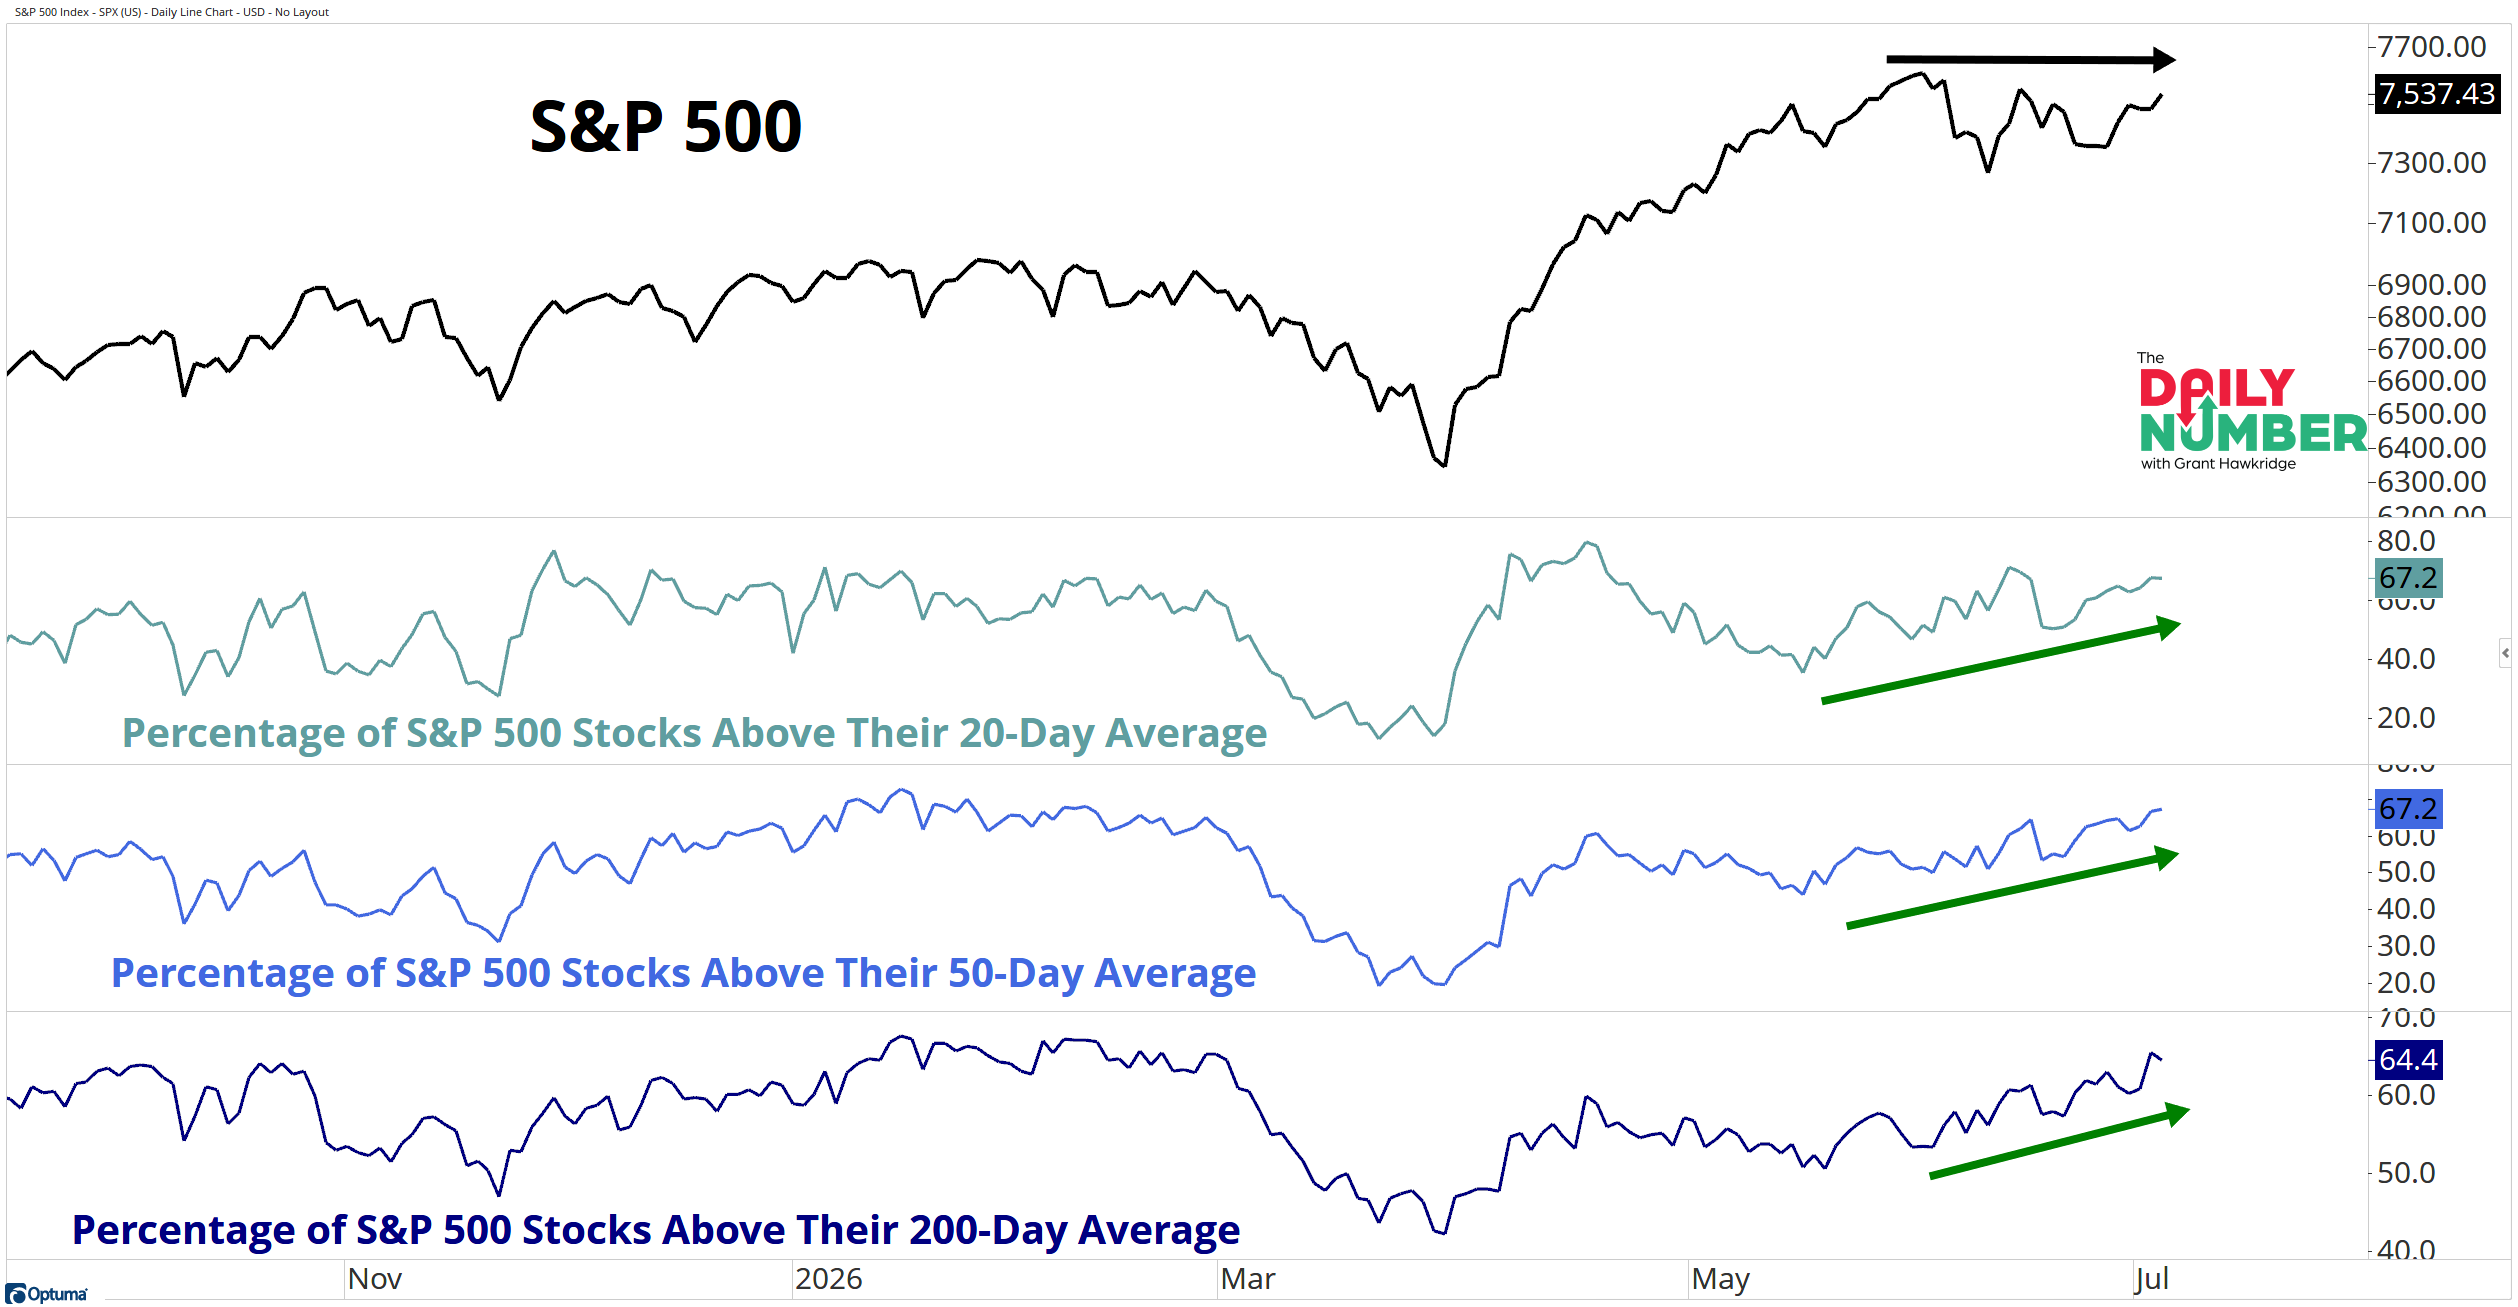
67.2% of S&P 500 stocks now trade above their 20-day moving average. The index has gone nowhere. Under the surface, the market tells a different story.
Here’s the chart:
Let's break down what the chart shows:
The black line tracks the S&P 500 Index.
The teal line tracks the percentage of S&P 500 stocks trading above their 20-day moving average.
The blue line tracks the percentage of S&P 500 stocks trading above their 50-day moving average.
The dark blue line tracks the percentage of S&P 500 stocks trading above their 200-day moving average.
The Takeaway: The S&P 500 hasn't made much progress over the past month.
But the market underneath it has been telling a different story.
Participation has continued to expand while the index has gone sideways. Nearly two-thirds of S&P 500 stocks now trade above their 20-day, 50-day and 200-day moving averages. That's broad participation, not a handful of stocks carrying the index. More stocks are joining the advance, even though the S&P 500 hasn't reflected it yet.
That raised a question for me. If the S&P 500 has gone nowhere, where is the strength coming from?
The answer wasn't Technology. I dug into the sector data and found leadership had changed. Financials have quietly taken over. Health Care, Industrials and Utilities have all stepped up while Technology has taken a breather. Money hasn't left the market. It's simply flowing into different stocks.
That's the part the index can hide. Technology still carries a huge weight in the S&P 500, so when it pauses, the index can appear stuck. Underneath the surface, participation has continued to expand as other sectors have picked up the slack.
I'm not changing my view because the S&P 500 has gone sideways for a few weeks. I'm changing where I look. Leadership has already started to rotate, and that's where I'll be spending my time. When participation keeps expanding beneath the surface, it often becomes a market for picking stocks rather than simply buying the index.
Grant Hawkridge | Chief Aussie Operator, All Star Charts
Four times a year, every company in the S&P 500 tells you exactly how its business is doing.
Steve Strazza's Beat Report turns that earnings data into stock and LEAPS trades built to run, and for Independence Day you can lock in up to 63% off retail, plus a free quarter of the Jeff Macke Portfolio when you go annual.