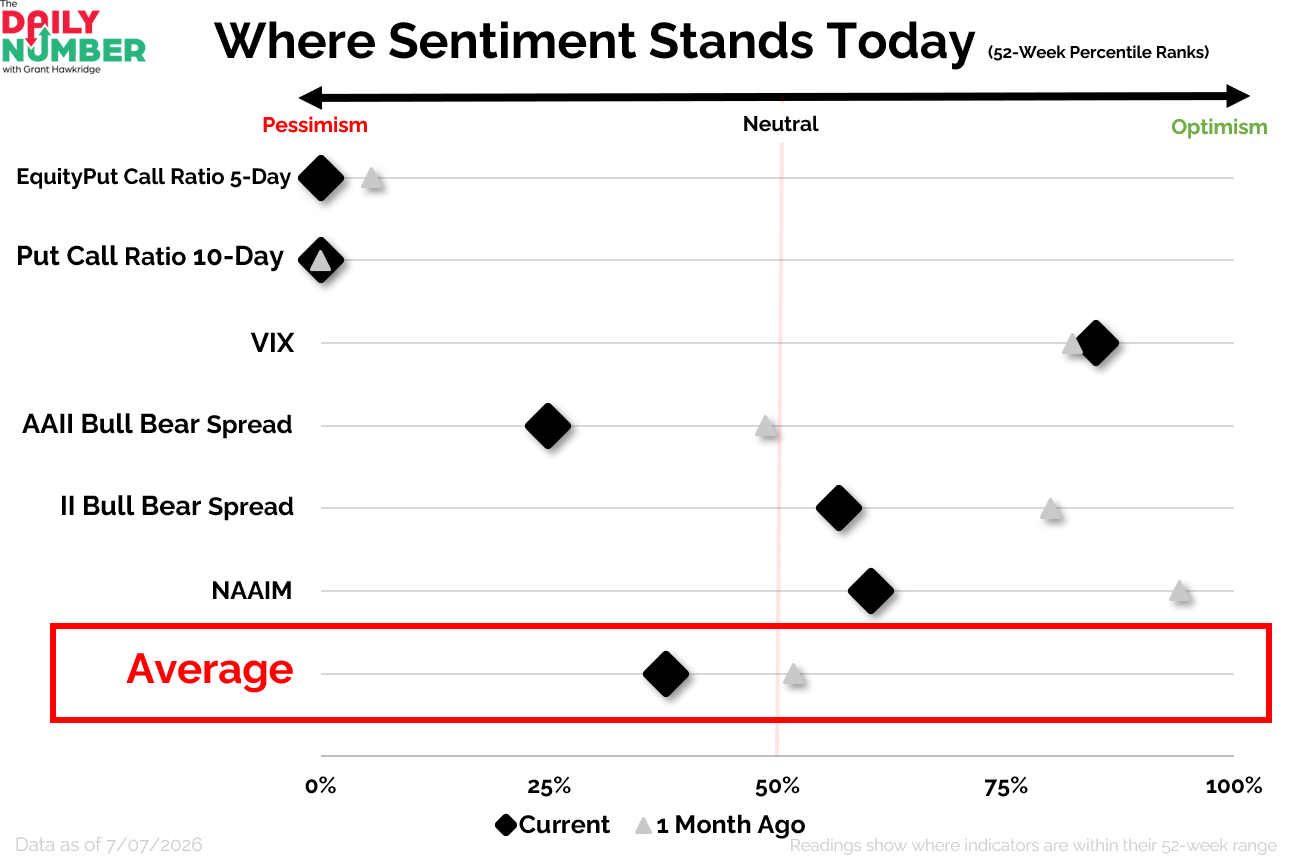
37.8% is the average sentiment reading across the indicators in this chart, measured against their own ranges over the past year.
The S&P 500 is still only 1.39% from all-time highs, yet sentiment has already slipped into the cautious side of the range.
Here’s the chart:
Let's break down what the chart shows:
The chart ranks each sentiment indicator against its own range over the past 52 weeks.
The black diamonds show the current readings.
The grey triangles show the readings from one month ago.
The average sentiment reading is 37.8% today.
One month ago, the average reading was 51.8%.
The Takeaway: 37.8% is not panic. But it is not comfort either.
The S&P 500 has not been hit with a major selloff. It has not broken down. It has simply spent the past month grinding sideways near the highs.
And that sideways grind has been enough to cool investors down.
The average sentiment reading has fallen from 51.8% to 37.8% over the past month. Investors have moved from roughly neutral into the cautious side of the range, even though price has barely given anything back.
That is the yellow flag.
The market has not scared investors with downside. It has made them tense with a lack of upside progress, rising news risk, and no clean breakout. Investors have a clear reason to stay guarded, even while the index remains close to its highs.
The shift is showing up in positioning. NAAIM has dropped from 94.0% to 60.2%. Active managers are still leaning positive, but they have pulled back from a much more aggressive position. That is not fear. It is reduced conviction.
Surveys are saying the same thing. Investor Intelligence has moved lower, and AAII has fallen to 24.9%. Advisers and retail investors are both less optimistic than they were a month ago. Options traders are even more defensive, with both put/call readings sitting at 0.0% of their one-year range.
But the VIX is not confirming stress. At 84.9%, volatility remains calm. So the message is mixed. Investors are more cautious, but the market is not showing real fear through price or volatility.
That is why I do not see this as a red flag. Price is still close to highs. But I also do not see it as a green light. Sentiment has cooled, the market has stalled, and buyers have not yet proven they can push through resistance.
A yellow flag does not tell me to get out. It tells me to stop assuming everything is fine.
Grant Hawkridge | Chief Aussie Operator, All Star Charts
Spencer Israel is going live every morning this week, July 6 to 9 at 9:30am ET, for a free 5-part series on the biggest defense spending cycle since 1947 and where the money is headed.
He's bringing in a different specialist each day to hunt for the names positioned to benefit. It's free to watch, but you have to save your spot.