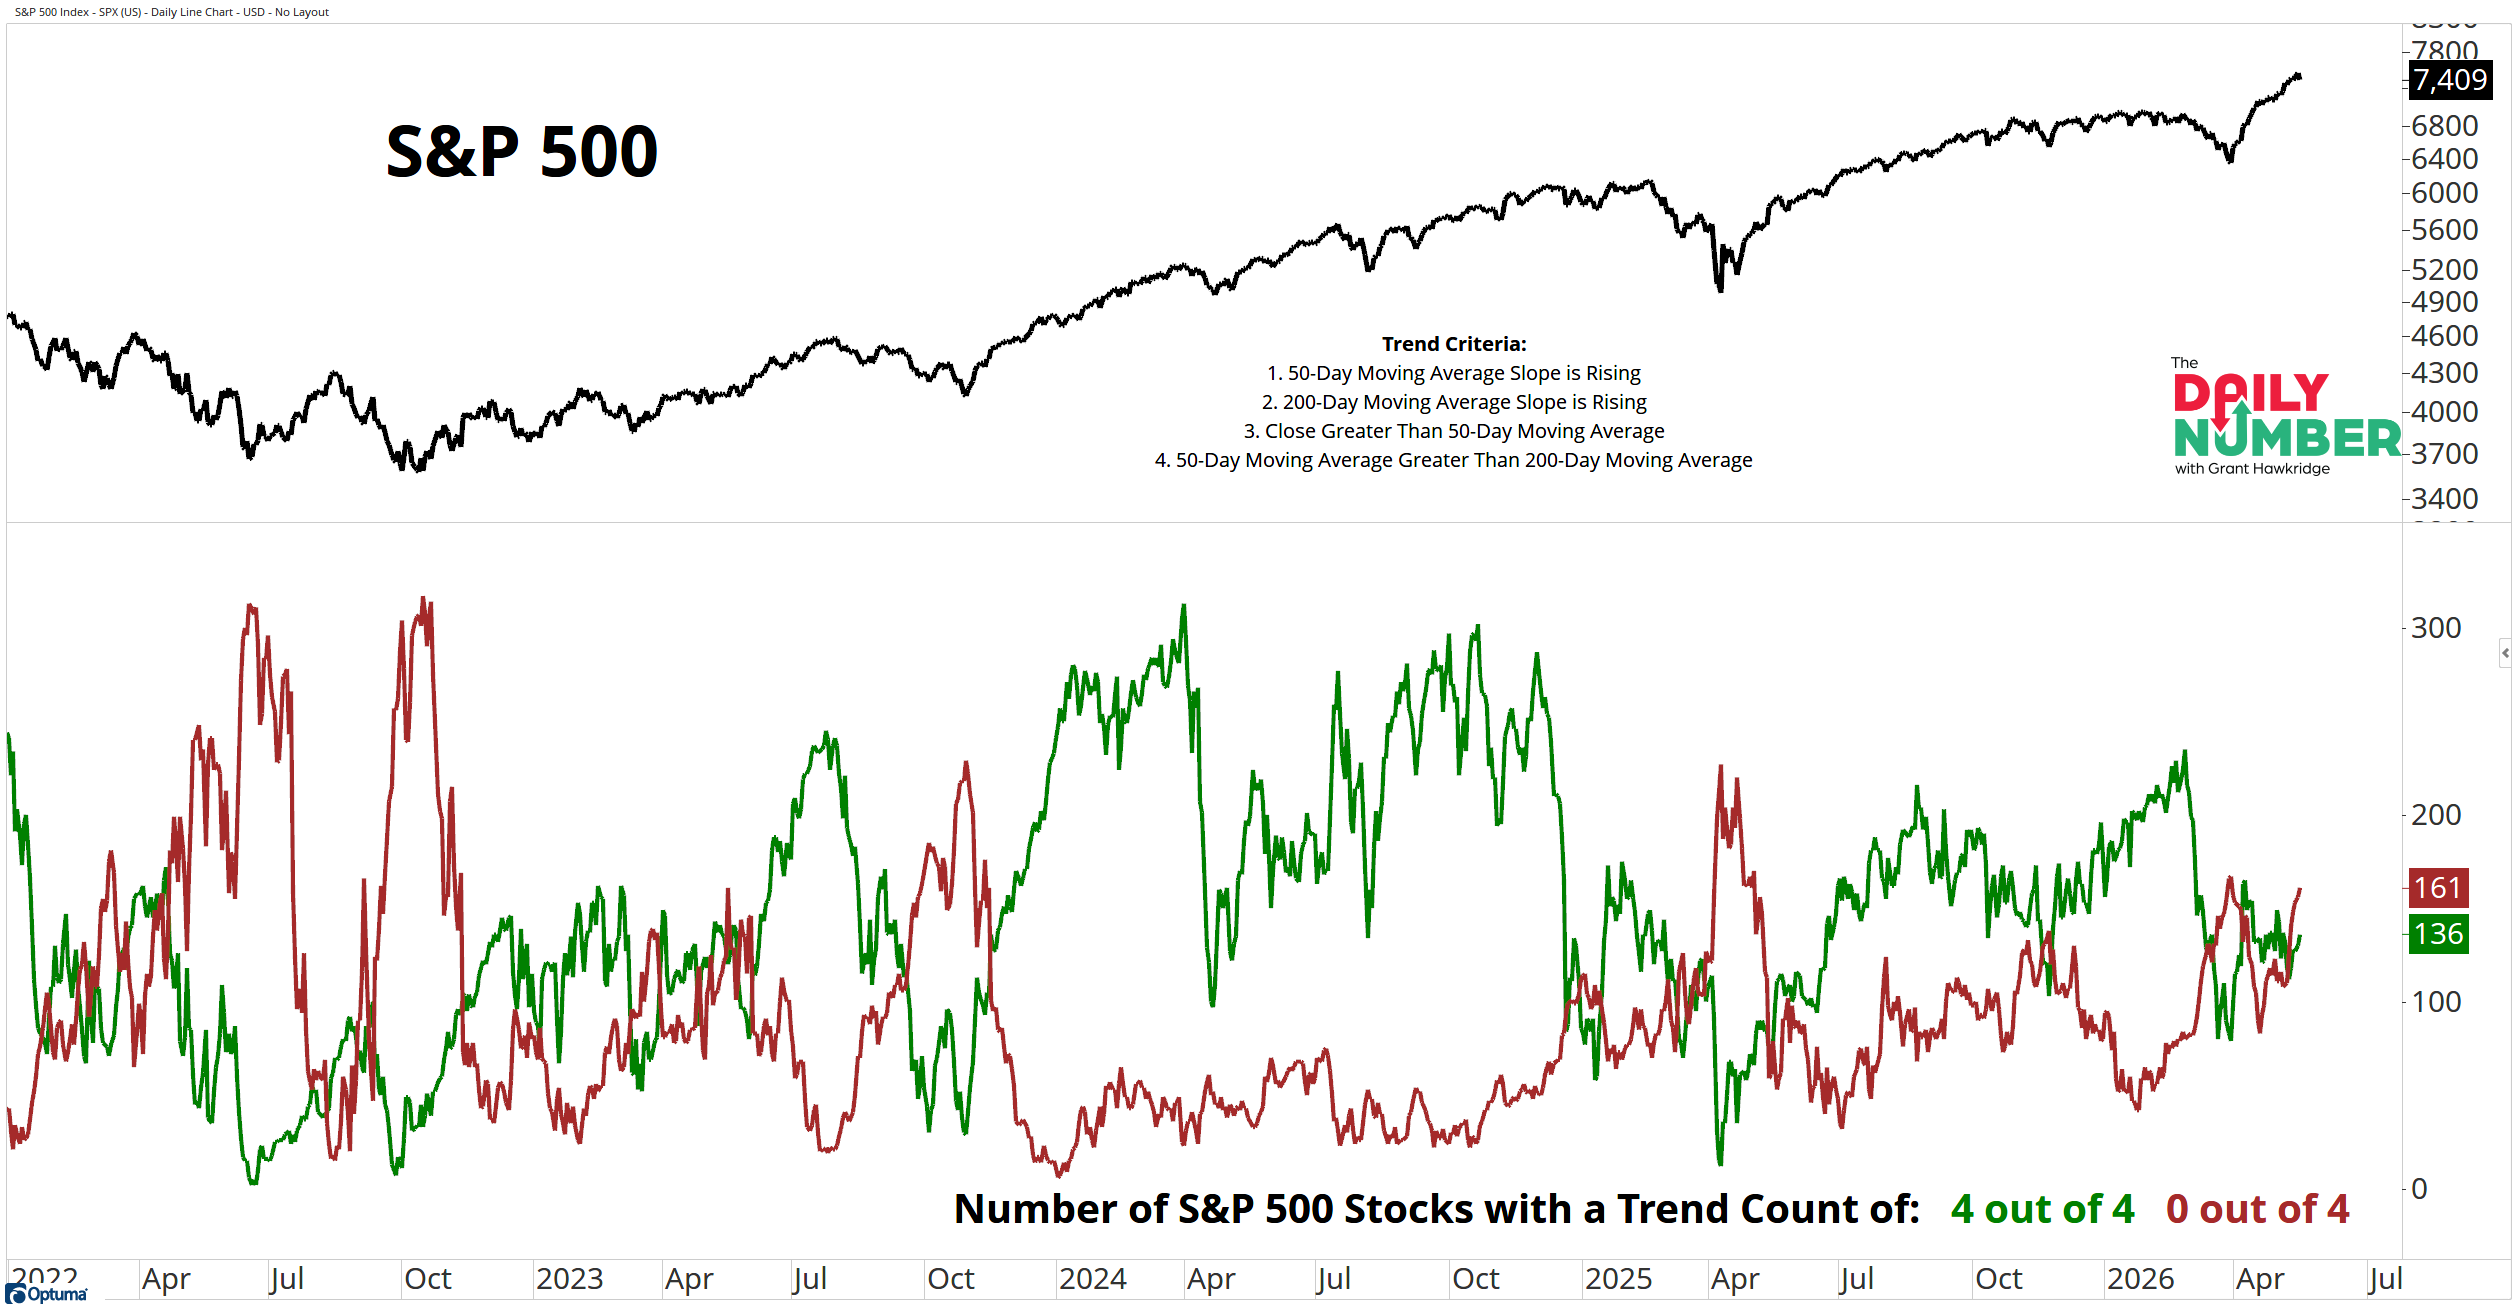
The S&P 500 is still sitting near the highs. But underneath the surface, more stocks are now breaking down than trending higher.
Here’s the chart:
Let's break down what the chart shows:
The top panel displays the S&P 500 Index in black.
The lower panel shows two lines tracking the number of S&P 500 stocks meeting a 4 out of 4 trend criteria in green and 0 out of 4 trend criteria in red.
The trend criteria include:
The 50-day moving average slope is rising
The 200-day moving average slope is rising
Price is above the 50-day moving average
The 50-day moving average is above the 200-day moving average
The Takeaway: There are now 161 S&P 500 stocks in confirmed downtrends, versus just 136 in confirmed uptrends.
That is a very different environment from the one the bulls enjoyed earlier this year.
Back then, participation was broad. More stocks were pushing higher together. Leadership kept expanding. The market had depth underneath the index itself.
That depth is now fading.
The S&P 500 still looks healthy on the surface because a smaller group of large-cap leaders continues holding the index near the highs. But the average stock inside the market is no longer behaving the same way. More names are losing trend support, slipping beneath key moving averages, and rolling into confirmed downtrends.
That does not mean the bull market is finished. But it does mean the environment is becoming less forgiving.
So what am I doing with this information? I’m getting more selective.
I’m still willing to own strong stocks making new highs, but I’m tightening risk management and becoming much less aggressive chasing breakouts across the board.
I’m also paying much closer attention to breadth than the index itself right now.
For me, this is the type of environment where I slow down a bit. I become more selective with new positions, less willing to force trades, and much quicker to cut anything that stops acting right.
Grant Hawkridge | Chief Aussie Operator, All Star Charts
Steve Strazza is hosting a free live training TODAY at 4:30 PM ET.
The Fast Money Masterclass.
He's walking through the proprietary indicator behind 14 doubles in 20 trades last month, and the simple strategy any investor can use to find trades that could 3x, 5x, even 10x in just a few days.