The Warning Signs Are Here… So Why Is The Market Still Ripping? 🔥
By Grant Hawkridge
May 25, 2026
Today's number is... 17.3%
Seasonal weakness is here. The breadth regime has ended. And yet the S&P 500 just delivered one of the strongest momentum surges of the past 70 years. The index gained 17.3% across eight straight up weeks.
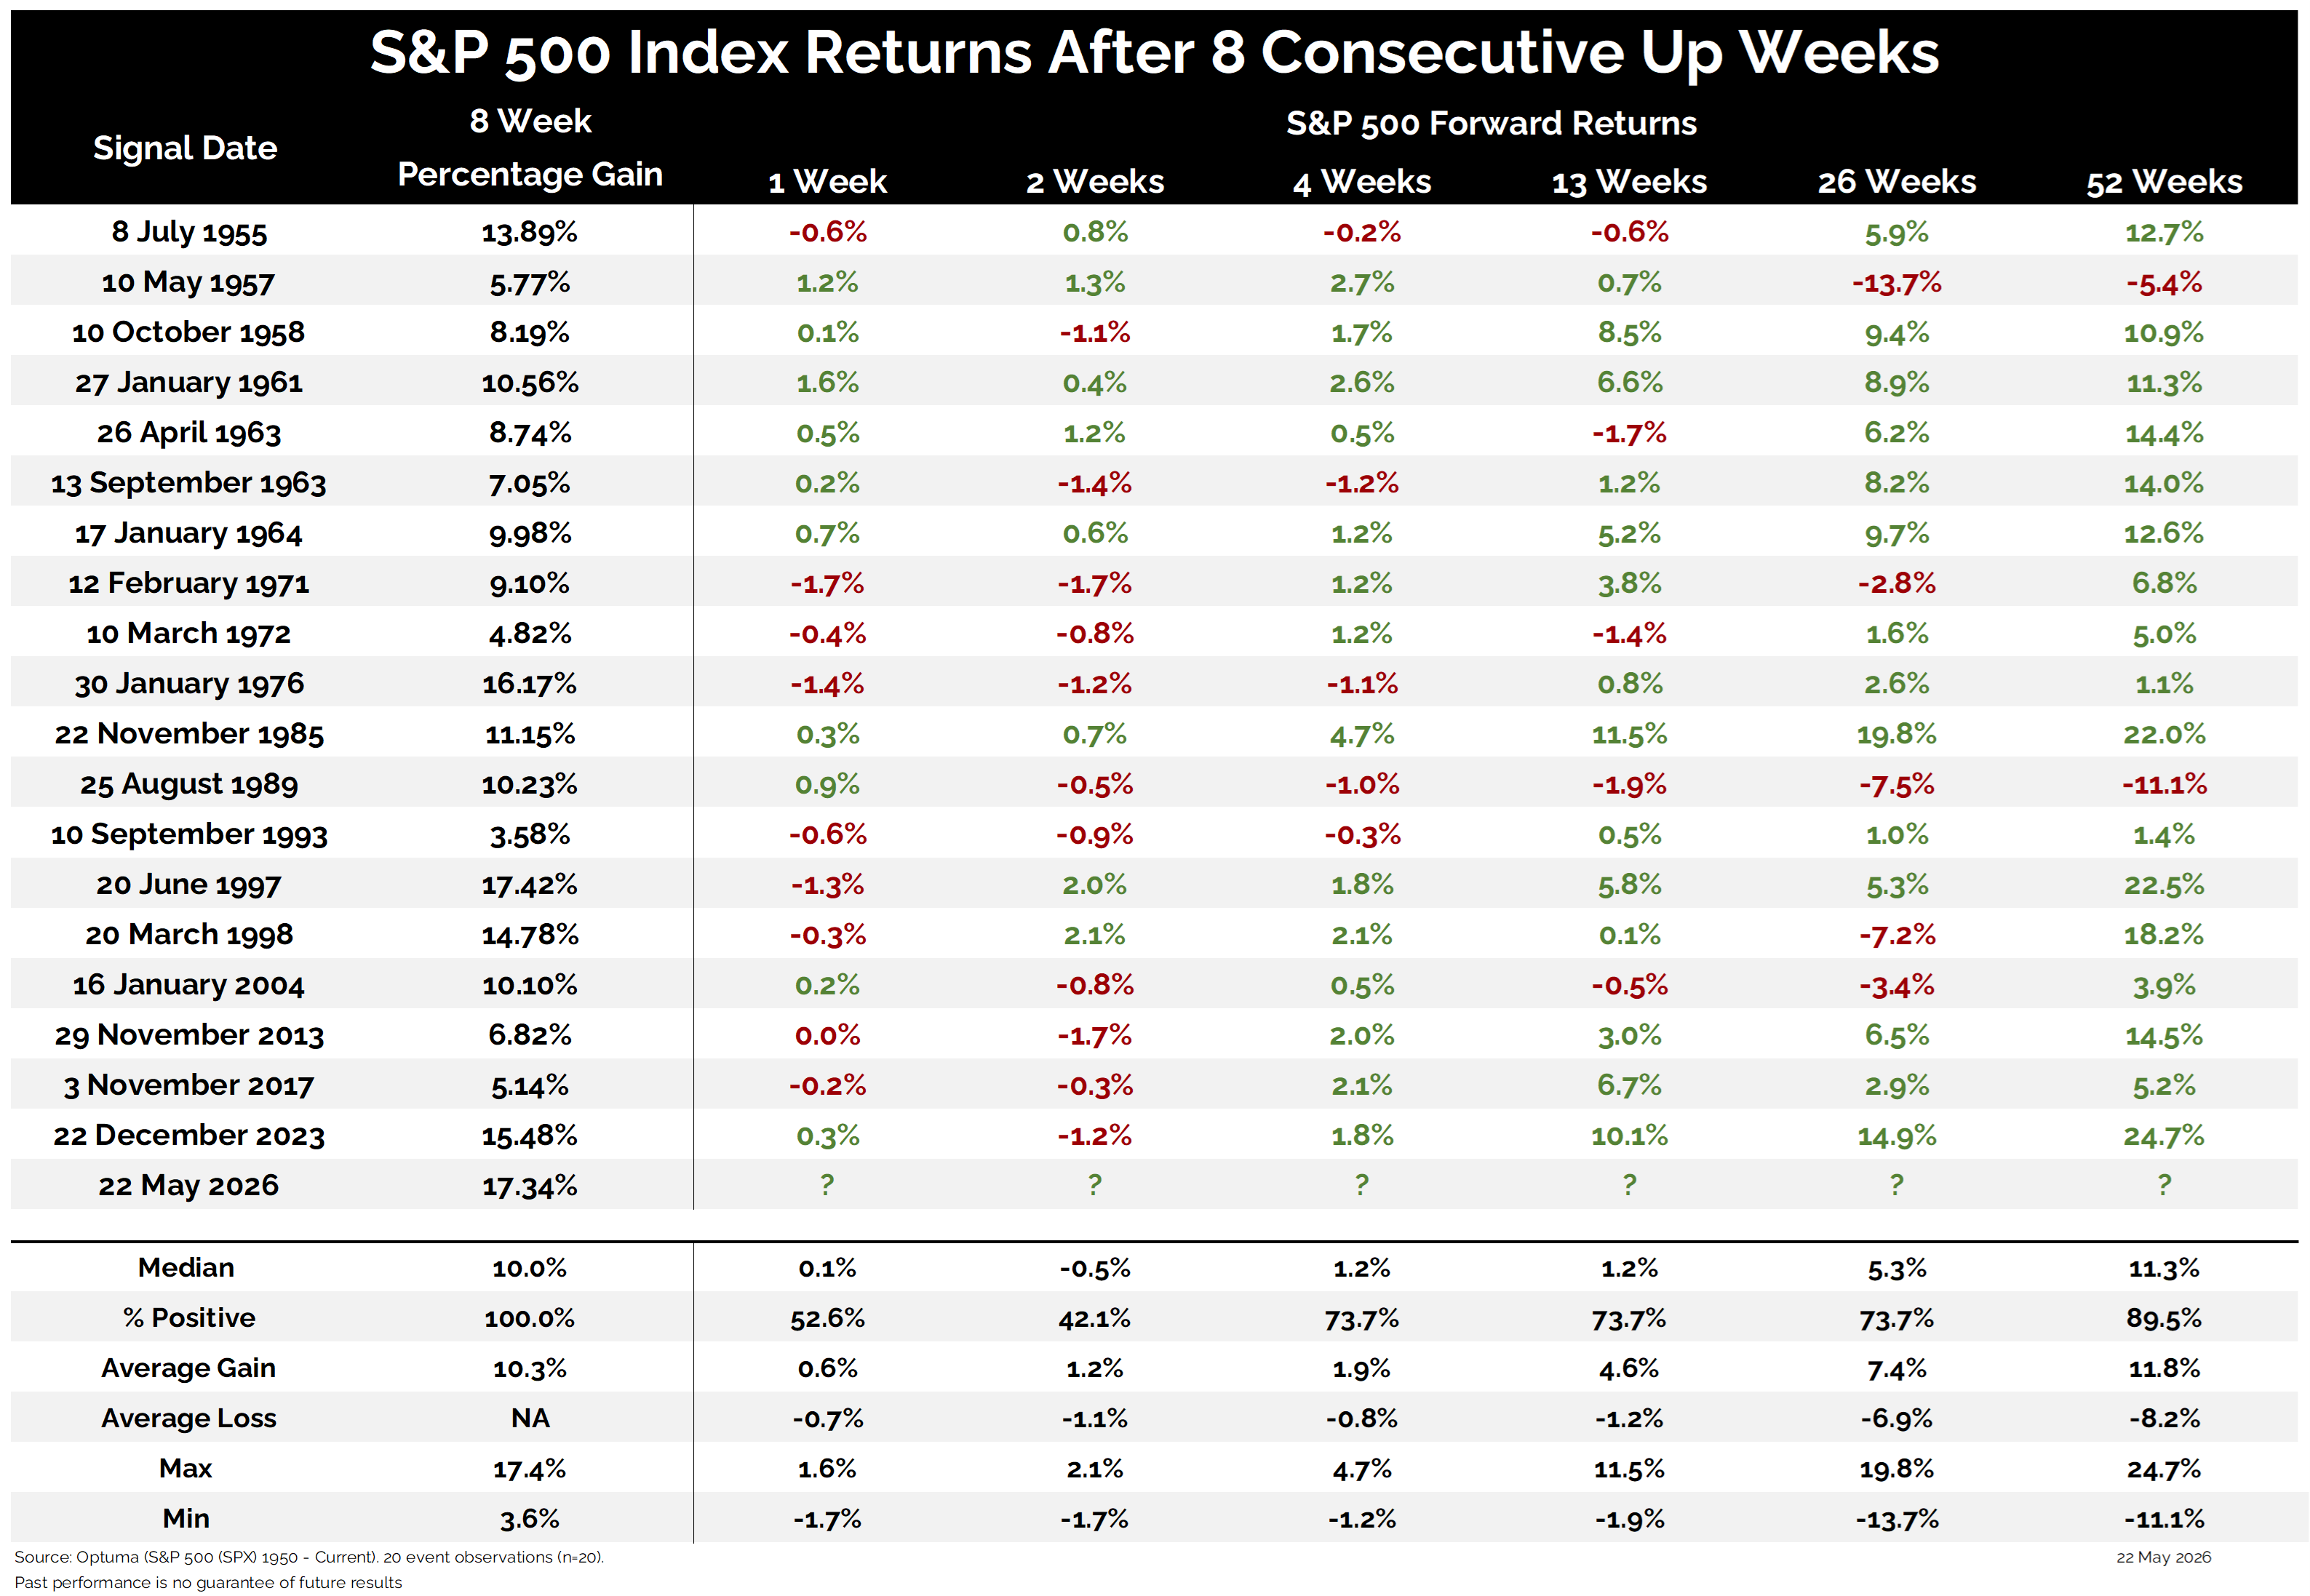
Here’s the table:
Let's break down what the table shows:
The table lists every occurrence since 1950 where the S&P 500 gained for eight consecutive weeks.
Each row displays the ending date of the streak, the total 8-week percentage gain, and the S&P 500’s forward returns after 1 week, 2 weeks, 4 weeks, 13 weeks, 26 weeks, and 52 weeks.
The Takeaway: The market keeps giving investors reasons to get cautious. But the trend still refuses to break.
Normally, that combination would slow things down. Narrowing breadth. Seasonal weakness. More stocks rolling into downtrends beneath the surface. The type of environment where markets usually get choppier, not stronger.
But that is not what price is doing right now.
Instead, the S&P 500 just finished its eighth straight up week and delivered one of the strongest momentum thrusts seen in the past 70 years. The index gained 17.3% during the streak, making it the second-strongest 8-week advance in over 70 years.
Only one move was stronger: June 1997.
And after that signal, the S&P 500 gained over 22% over the next 12 months.
The current move is also far stronger than normal. The median 8-week gain across all prior signals was 10%. This one came in at 17.3%.
That does not mean the market moves straight up from here. Historically, short-term pauses after these thrusts are common. In fact, 2-week forward returns were positive only 42.1% of the time after prior signals. Momentum this aggressive often needs time to cool off.
But the longer-term message from the table is much harder to ignore.
The average 12-month return after these signals was 11.8%. Most of these momentum thrusts happened during powerful bull market environments, not at major market tops.
So right now the market is sending two very different messages at the same time. Beneath the surface, some cracks are starting to appear, and until that trend actually breaks, the bulls still deserve the benefit of the doubt.
Because at the end of the day, I do not get paid for predicting tops. I get paid for respecting price. And right now, price is still acting like a market under accumulation, not distribution.
Fighting strong trends is one of the fastest ways to lose money. So, until the market proves otherwise, I would rather stay aligned with the trend that is actually paying us than bet against it because of what “should” happen.