This Isn't What a Midterm Year Is Supposed to Look Like 👀
By Grant Hawkridge
June 1, 2026
Today's number is... 16.1%
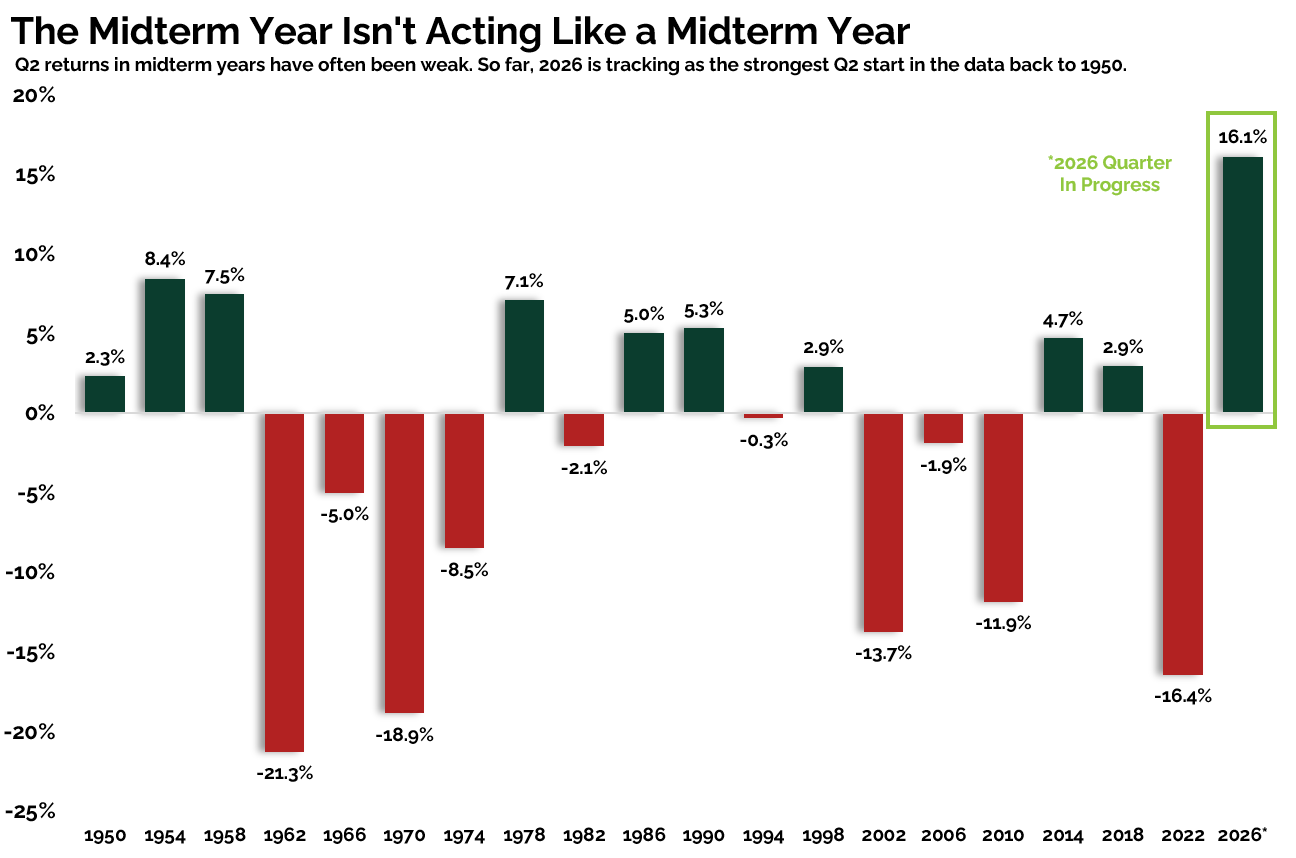
The market just delivered the strongest start to a midterm-year Q2 in the data going back to 1950. That's happening during a period that is supposed to be one of the toughest stretches of the entire presidential cycle.
Here’s the table:
Let's break down what the table shows:
The chart displays Q2 returns for every midterm year since 1950.
Positive quarters are shown in green and negative quarters are shown in red.
The Takeaway: Midterm years have earned their reputation.
Some of the largest Q2 declines in this dataset occurred during midterm years. Those years helped create the idea that this period of the presidential cycle is supposed to be difficult for investors.
But the market doesn't trade the average.
Seasonal patterns tell us what has happened before. Price tells us what is happening right now. And right now, the market is doing something very different from the historical script.
The S&P 500 is up 16.1% through the first two months of the quarter. That's nearly double the strongest completed Q2 gain in the entire midterm-year dataset.
Everybody is taught that midterm years get tougher around this point. That's what makes this chart interesting.
The market is supposed to be getting weaker right now. Instead, it's posting the strongest start to a midterm-year Q2 since 1950.
That's why I pay attention when price starts doing the opposite of what history says should happen.
So, what am I doing with this information?
I'm respecting the trend.
The calendar says this should be a difficult period for stocks. Price says buyers remain in control. When those two things disagree, I side with price.
Seasonal patterns are useful. But they don't pay me. Trends do.
Until that trend breaks, the bulls still deserve the benefit of the doubt.