The market's biggest winners finally got hit. Technology stocks led the selloff as the S&P 500 fell 2.6% on Friday, its first decline of 2% or more in 93 trading days.
Here’s the chart:
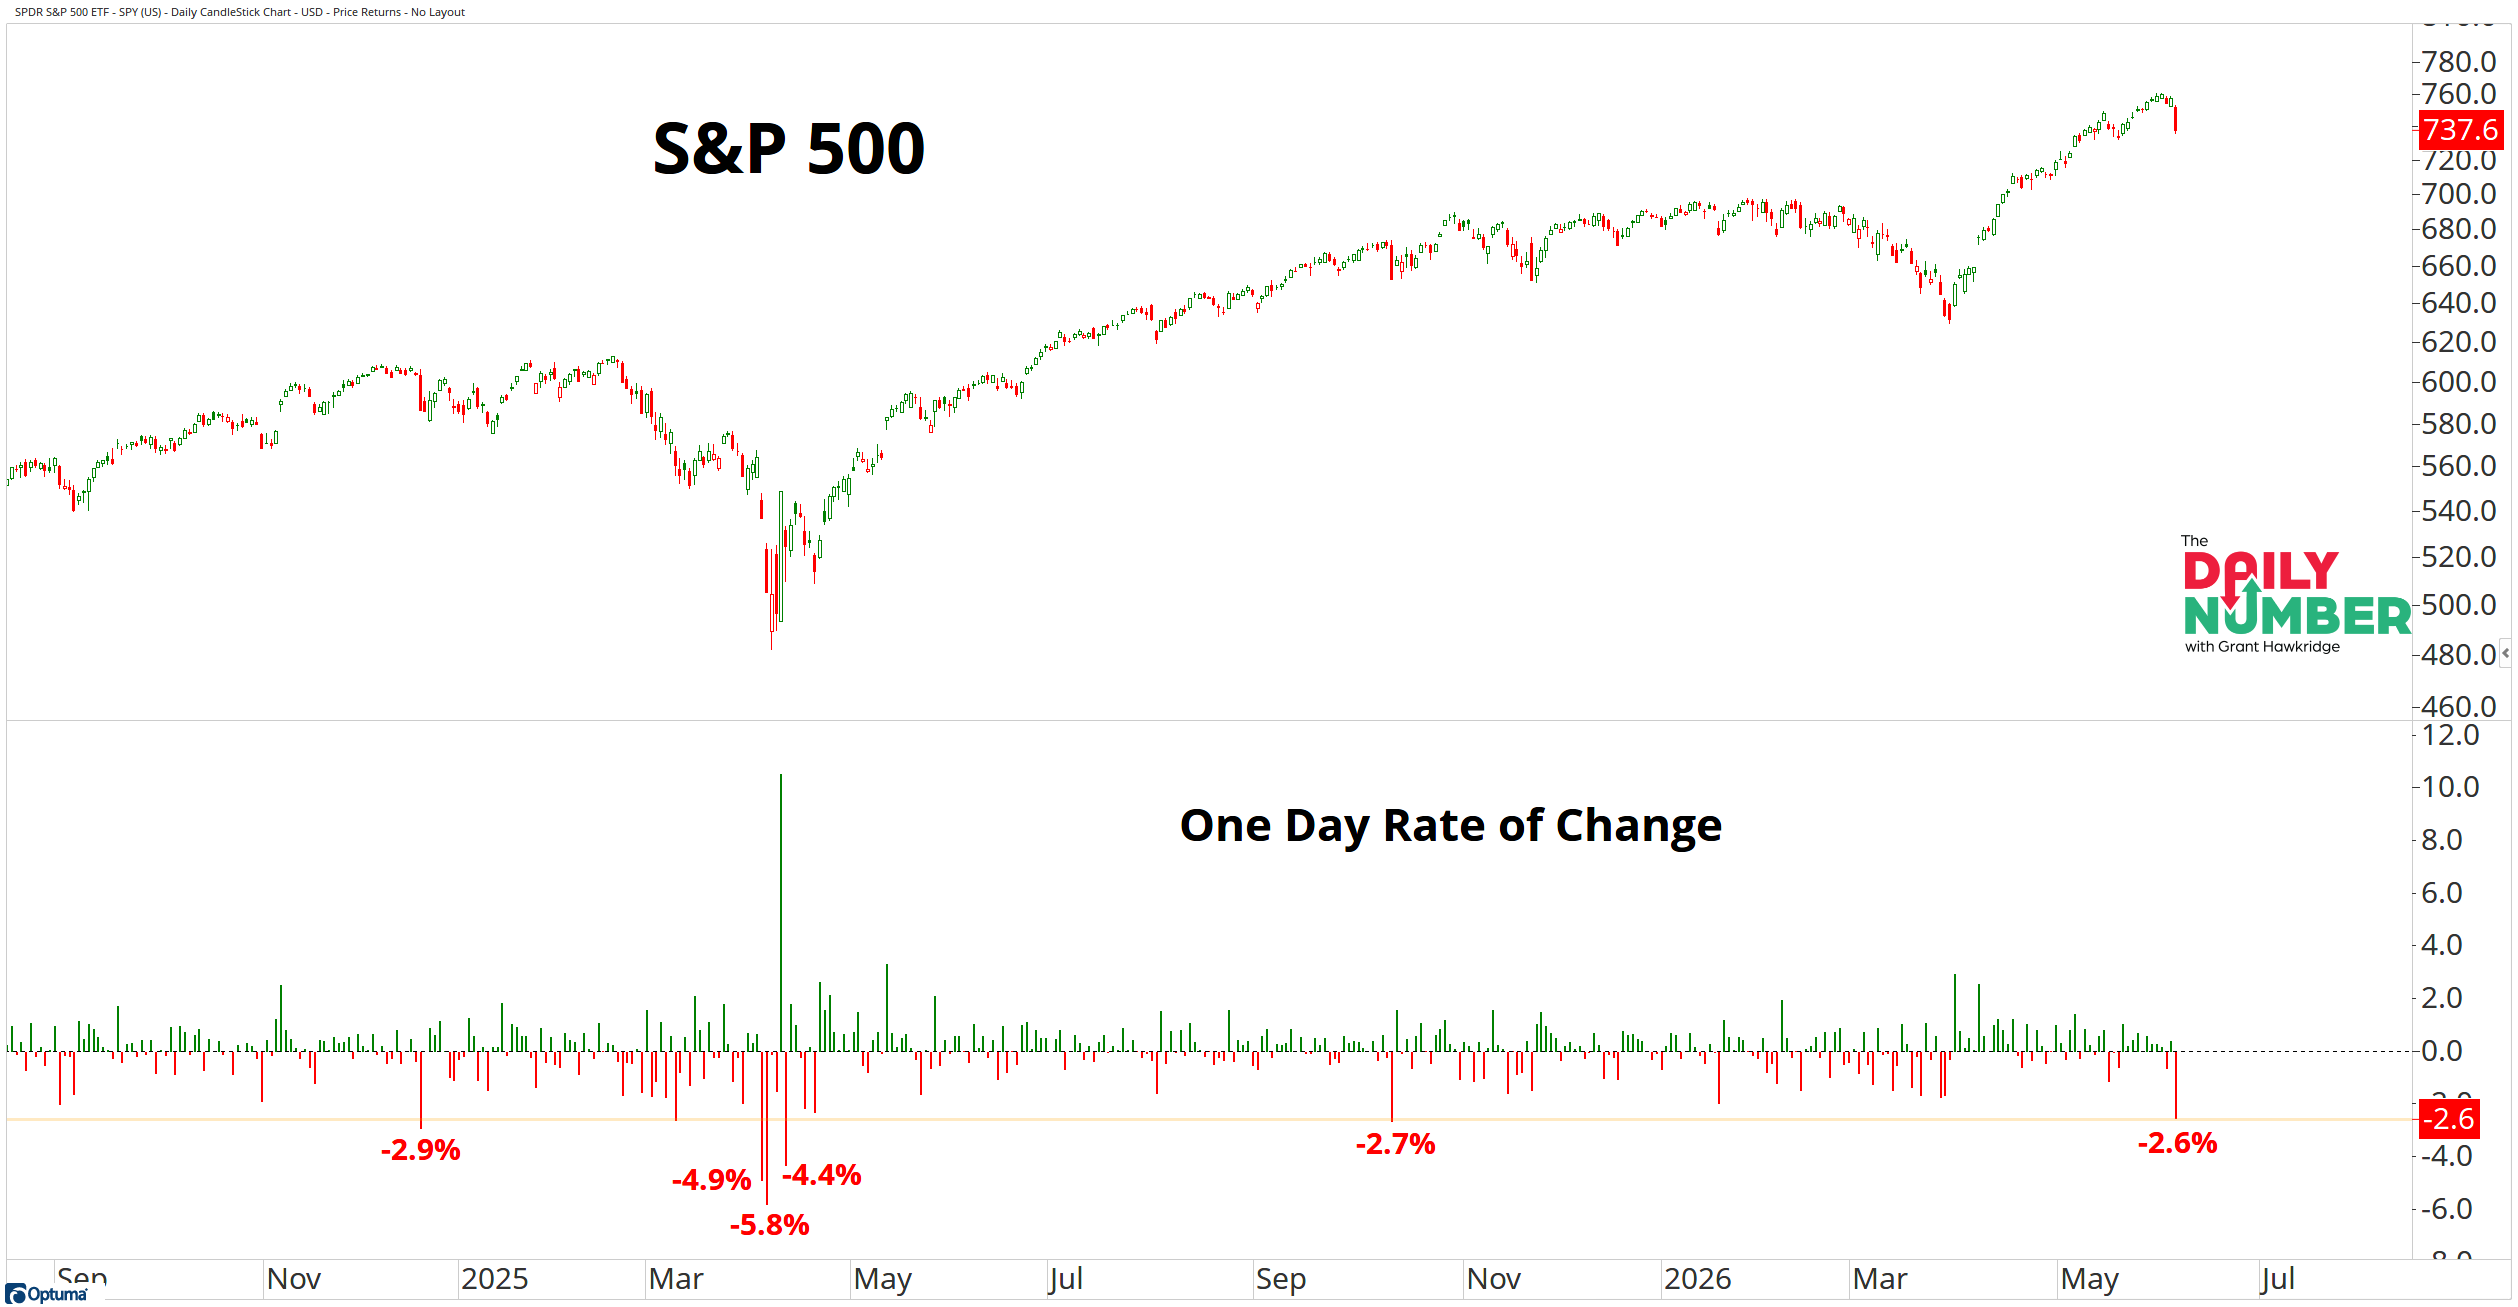
Let's break down what the chart shows:
The top panel shows the S&P 500
The bottom panel shows the daily percentage change of the S&P 500.
Green bars represent positive daily returns.
Red bars represent negative daily returns.
The Takeaway: The first thing to remember is that trends don't usually change in a day.
Friday's decline was sharp, but one trading session isn't enough to reverse a bull market. The primary trend remains higher. The S&P 500 entered the selloff near all-time highs and most of the evidence that supported the advance remains intact for now.
What caught my attention wasn't the size of the decline. It was the names getting sold. Technology and semiconductor stocks have been leading this market for most of the year. On Friday, they were the ones under pressure.
The market had gone 93 trading days without a single 2% decline. That's a long stretch without a meaningful volatility shock. Markets rarely stay that quiet forever. Pullbacks are a normal part of every bull market, even the strongest ones.
This selloff arrived after risk appetite had climbed to its highest level in roughly five years. Global participation remained strong and major markets around the world were still trending higher. At the same time, the 20-Day High Breadth Thrust regime had recently expired and leadership had become increasingly concentrated in technology stocks.
The bull market remains intact. But the weight of the evidence is becoming less bullish. Some of the strongest tailwinds from earlier in the advance are fading, while a growing number of caution flags are beginning to appear beneath the surface.
Now we find out whether Friday was a reset or the start of something more meaningful.
I'll be watching whether new highs start to expand again or whether new lows begin to build beneath the surface. I'll also be watching for signs that money is rotating into other sectors rather than leaving stocks altogether.
For now, the primary trend still points higher. Until that changes, I'll continue treating Friday as a pullback within an ongoing bull market rather than the start of something bigger.