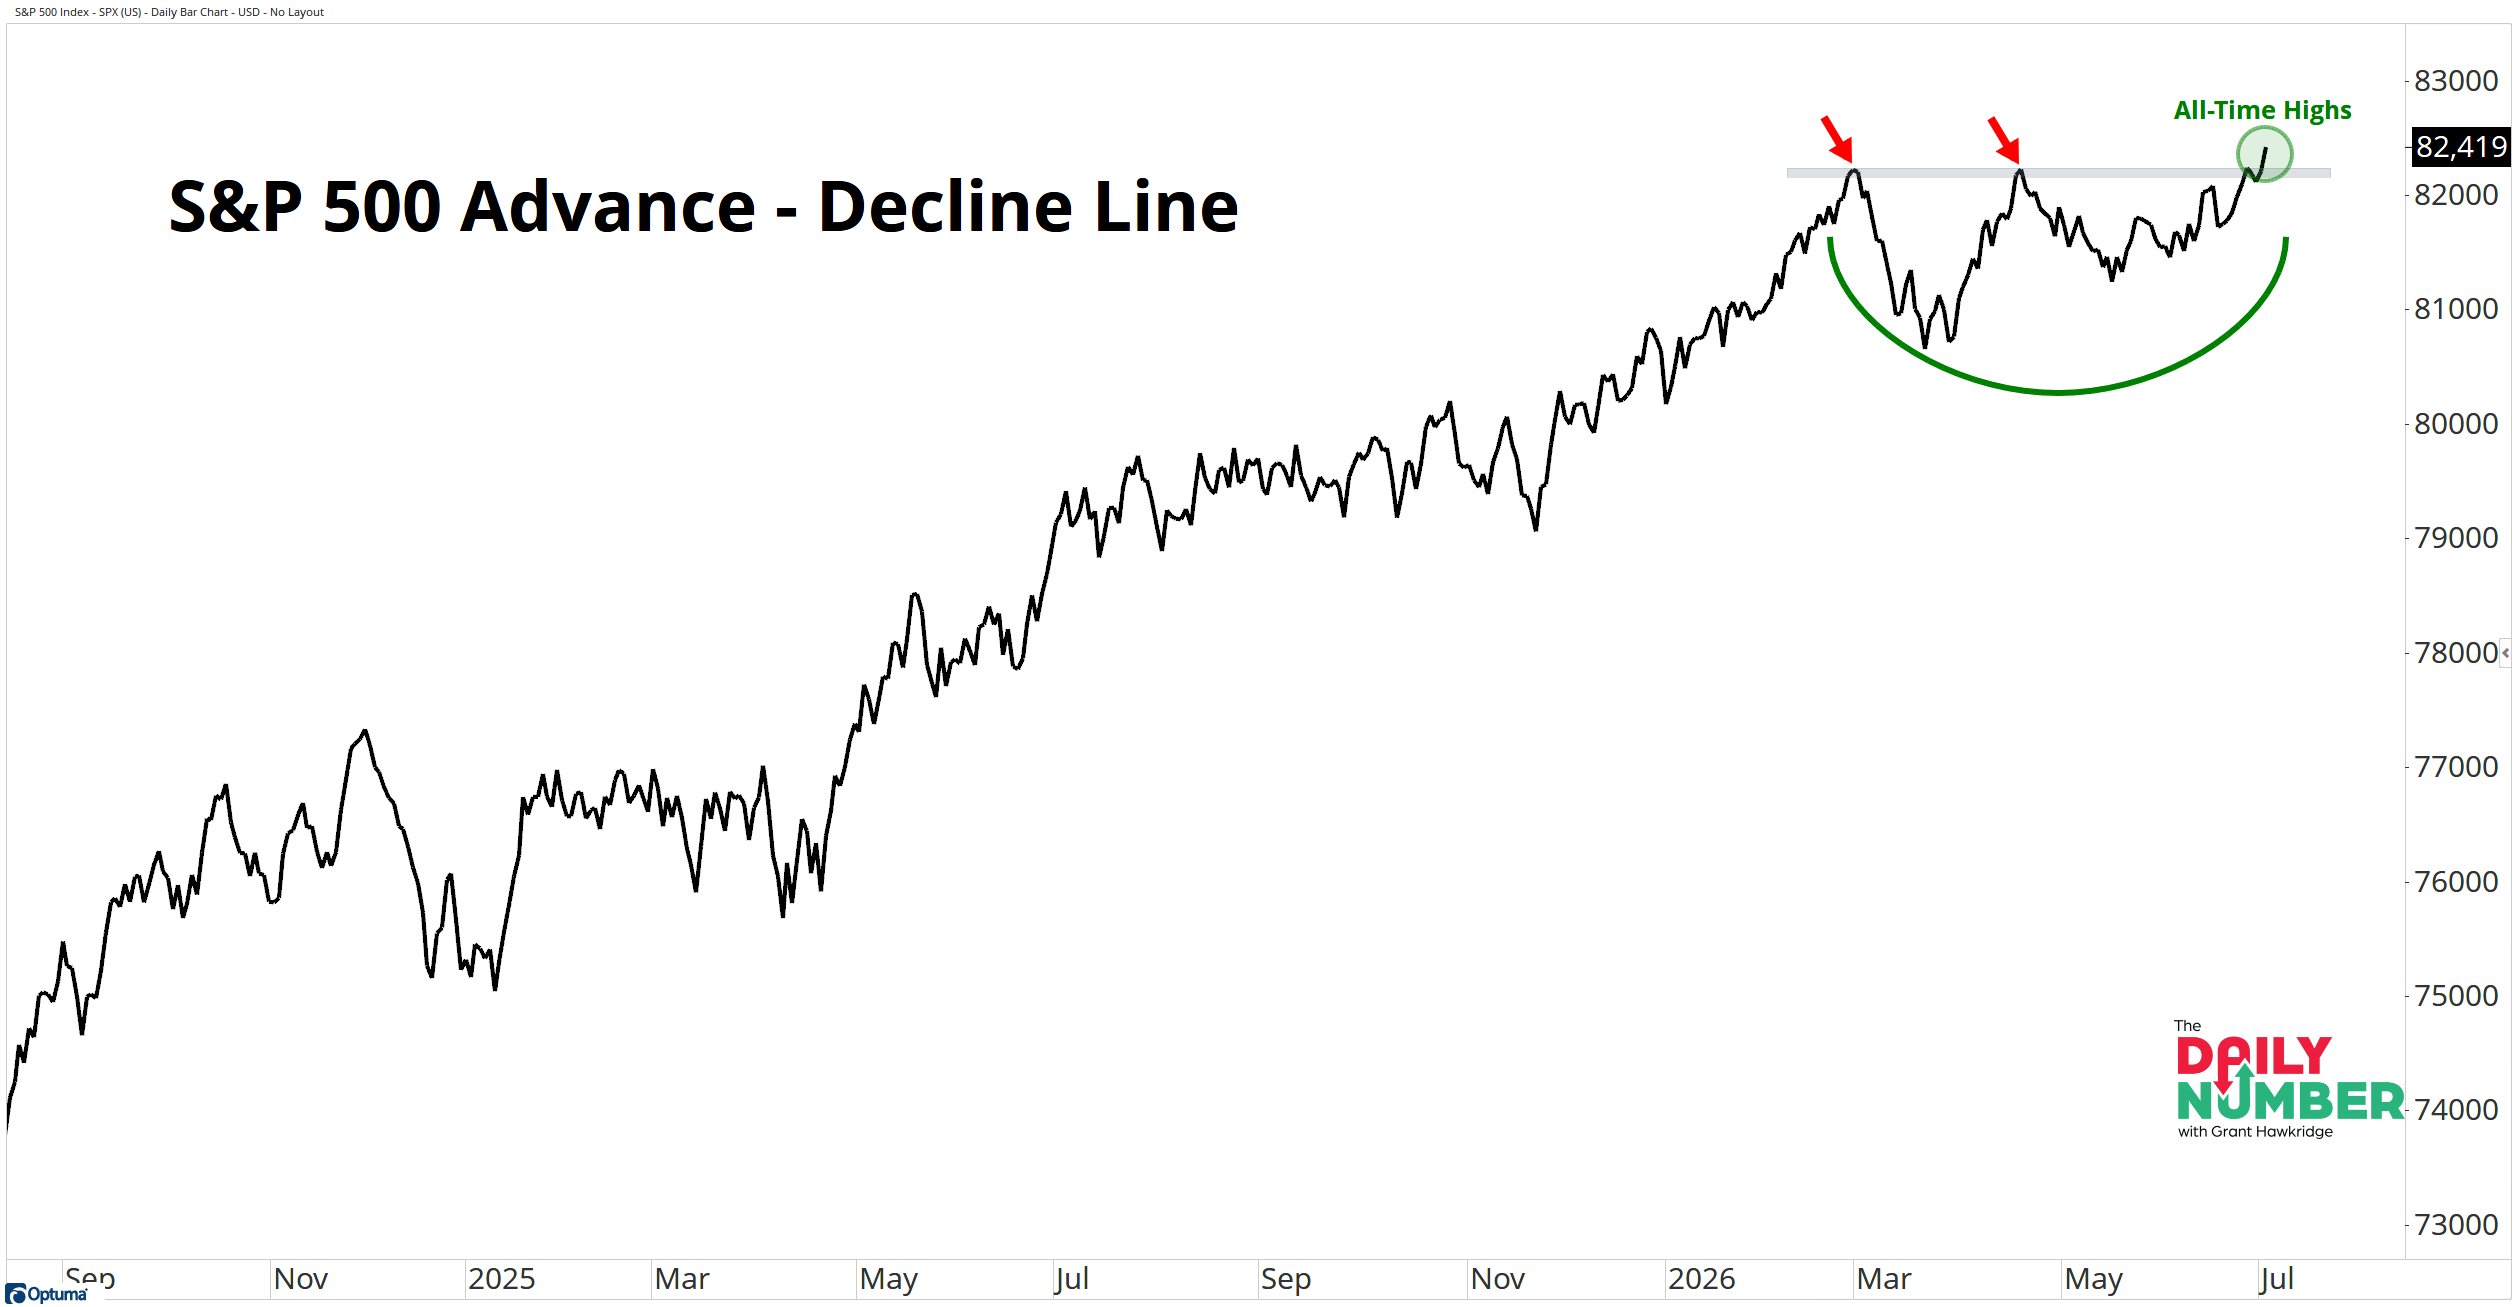
Most traders spent Thursday watching the technology sell off. Beneath the surface, one of the market's most important indicators was breaking to a new all-time high.
Here’s the chart:
Let's break down what the chart shows:
The chart displays the S&P 500 Advance-Decline Line in black.
A horizontal grey line marks the previous highs, while two red arrows highlight earlier peaks that failed to break above that level. A green circle marks the latest breakout to a new all-time high.
The Takeaway: The market just delivered one of the strongest breadth signals it can produce.
The Advance-Decline Line has reached a new all-time high. That's a sign participation across the market continues to broaden, rather than being driven by just a handful of stocks.
Breadth tested this level twice earlier this year but couldn't break through. Rather than falling apart, it spent the next few months rebuilding before finally pushing above resistance.
That isn't price breaking out. It's the market's internal health breaking out.
Thursday didn't look like a strong breadth day at first glance, but net advancing stocks finished at 42.5%, meaning advancers comfortably outnumbered decliners across the S&P 500. Technology was weak, but Consumer Staples, Utilities and Health Care picked up the slack.
Money kept flowing into stocks. It simply flowed into different stocks.
Healthy bull markets don't need every sector moving higher together. Leadership rotates while the broader market keeps expanding. If everything was rolling over together, this chart wouldn't be making new highs.
Technology had a weak day, but I'm not changing my view because of one sector. If breadth starts weakening alongside Technology, that's a different story. Right now, this still looks like rotation inside a bull market.
With the Advance-Decline Line having just broken to a new all-time high, I'll keep looking for leadership instead of looking for reasons to turn defensive. If breadth starts rolling over, that's a different conversation. Right now, it isn't.
Grant Hawkridge | Chief Aussie Operator, All Star Charts
Four times a year, every company in the S&P 500 tells you exactly how its business is doing.
Steve Strazza's Beat Report turns that earnings data into stock and LEAPS trades built to run, and for Independence Day you can lock in up to 63% off retail, plus a free quarter of the Jeff Macke Portfolio when you go annual.