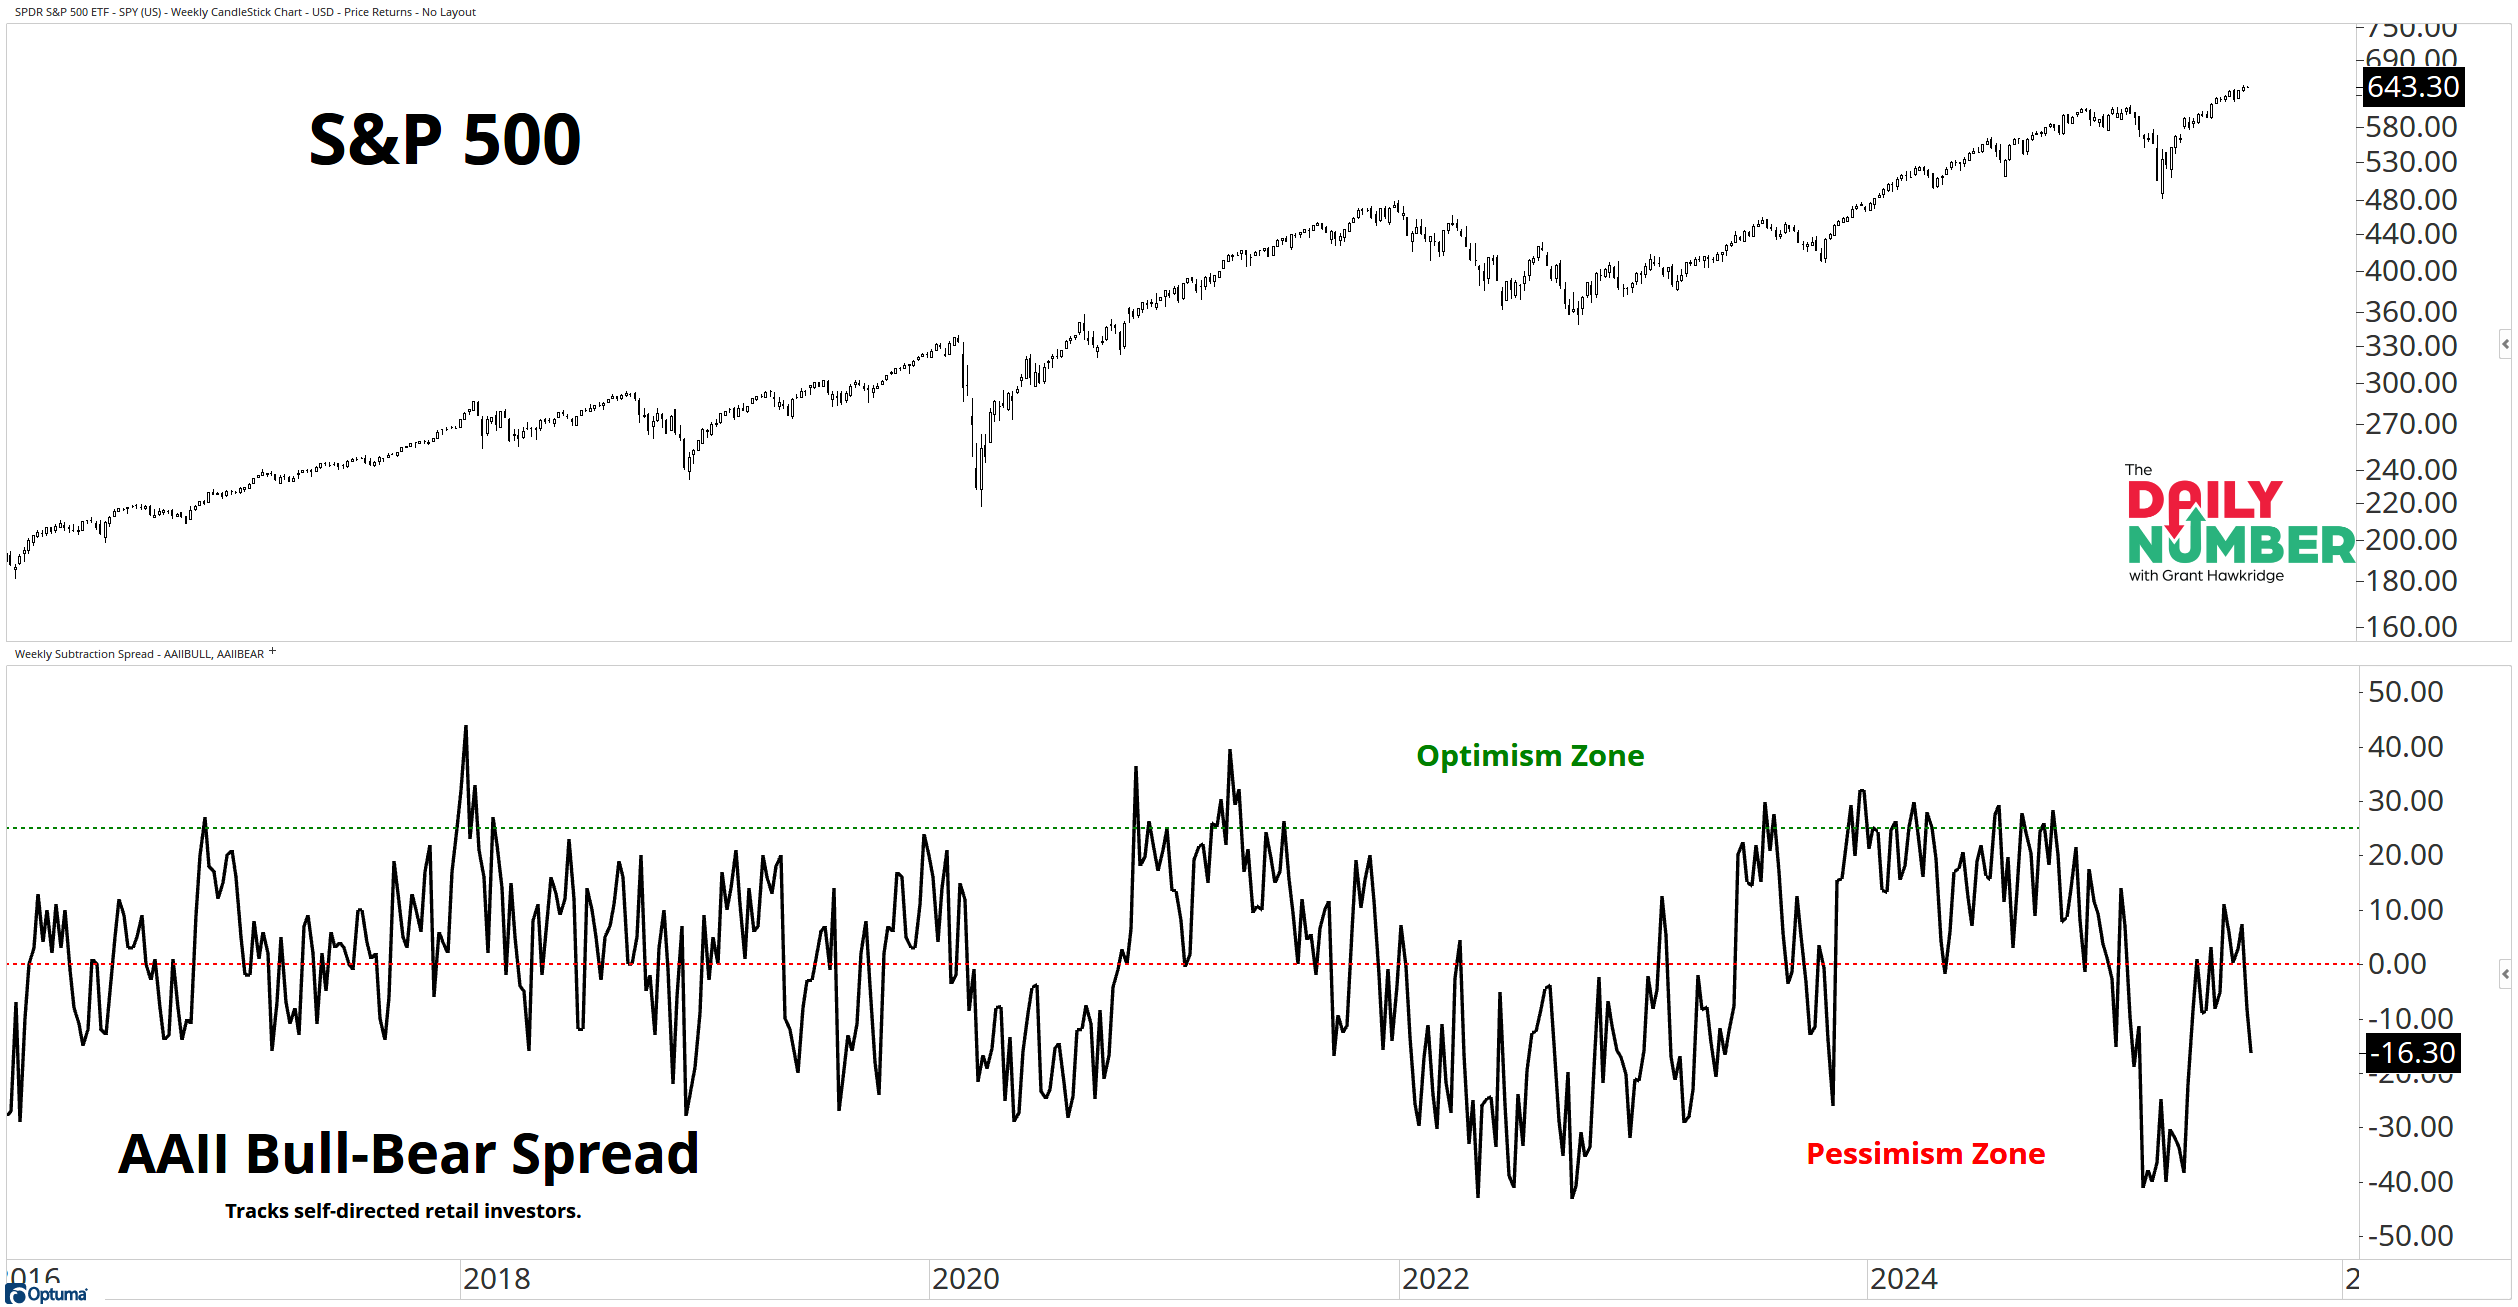
The AAII Bull-Bear Spread dropped to -16.3, telling us that more retail investors expect stocks to fall than rise.
Here’s the chart:
Let's break down what the chart shows:
The top panel plots the S&P 500 daily close in black.
The lower panel shows the AAII Bull-Bear Spread in black. The green line marks optimism at +25%. The red line marks pessimism at 0%.
The Takeaway: The S&P 500 and Nasdaq are sitting near all-time highs — yet there are more bears than bulls among retail traders. How is that even possible?
Price is strong.
Professionals are fully allocated.
Yet the retail crowd still expects weakness. Do they know something the pros don’t — or are they just drowning in bearish headlines?
A market climbing with this much disbelief underneath it usually isn’t near the end.
It’s doubt in the face of strength, and that doubt means positioning is light, not stretched. This type of disbelief keeps cash on the sidelines and retail investors under-exposed. So, when that gap finally closes, it often adds fuel, not pressure, to the overall trend.
So who do you trust here — the tape, or the crowd?
Grant Hawkridge | Chief Aussie Operator, All Star Charts
Need a full trading toolkit that actually helps you make moves? All Star Charts Premium gives you daily trade ideas, proprietary scans, and access to our entire analyst team. If you're serious about leveling up your strategy, start here.
If you find my content valuable, I would greatly appreciate it if you could share it with your friends, family, and colleagues. Your help in spreading the word is invaluable in supporting our work. Thank you to all of you who share!