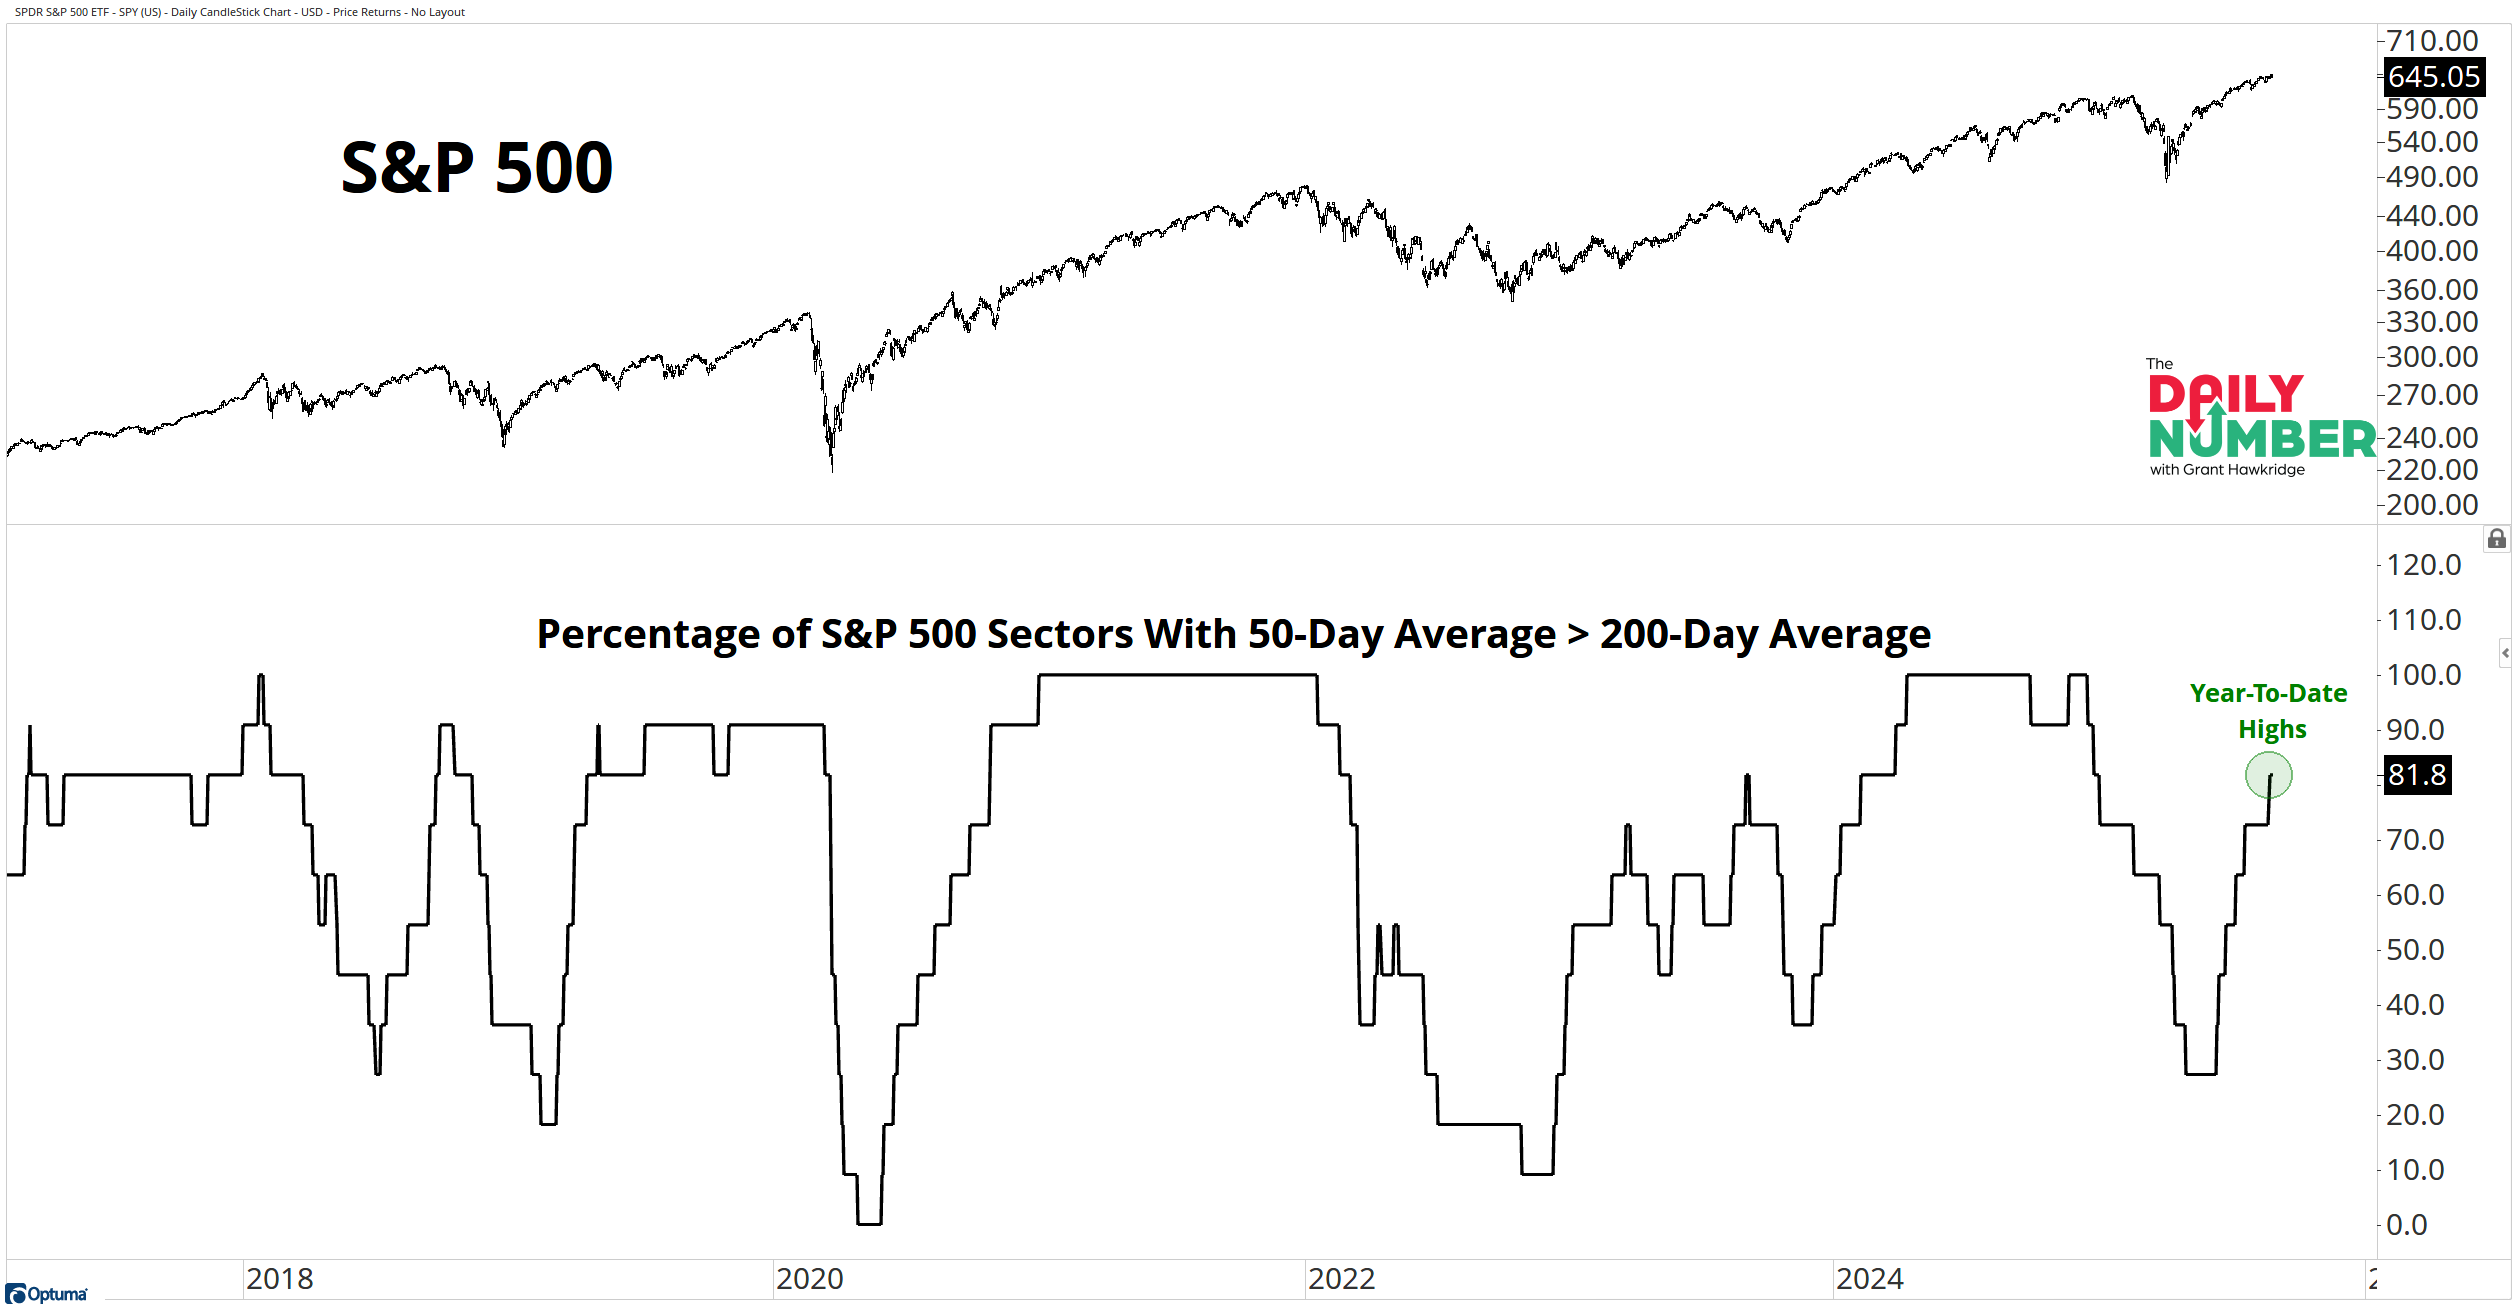
Sector breadth is at a year-to-date high, with 81.8% of S&P 500 sectors (9 of 11) trending higher.
Here’s the chart:
Let's break down what the chart shows:
The top panel shows the S&P 500 on a daily closing basis in black.
The bottom panel plots the percentage of S&P 500 sectors where the 50-day moving average is above the 200-day moving average in black.
The Takeaway: Sector breadth is sitting at year-to-date highs, with 81.8% of S&P 500 sectors trending higher.
That level of participation is the broadest we have seen this year.
This type of strength changes the character of the move.
Rallies backed by most sectors tend to be stronger because buying is spread across the list, not concentrated.
When breadth is this strong, the tape has a foundation underneath it.
In 2019, in 2021, and again in 2024, rallies paired with sector breadth moving back above 80% carried further as widespread participation confirmed the move.
If breadth slips meaningfully from these highs, leadership narrows and the message shifts toward caution. But while it holds near the top of the year’s range, the backdrop remains supportive.
For now, breadth is sending a simple message: participation is strong, and the trend still has backing.
Grant Hawkridge | Chief Aussie Operator, All Star Charts
Need a full trading toolkit that actually helps you make moves? All Star Charts Premium gives you daily trade ideas, proprietary scans, and access to our entire analyst team. If you're serious about leveling up your strategy.
If you find my content valuable, I would greatly appreciate it if you could share it with your friends, family, and colleagues. Your help in spreading the word is invaluable in supporting our work. Thank you to all of you who share!